Short answer: Because the list price is not an estimate of value. In North Berkeley, 89% of second-quarter 2026 sales closed above list, at an average of 37% over asking, per The Berkeley Report. In the Berkeley Hills the averages were 86% and 32%. Sellers here list below expected value on purpose, to generate competition.
The list price here is a starting gun, not an appraisal
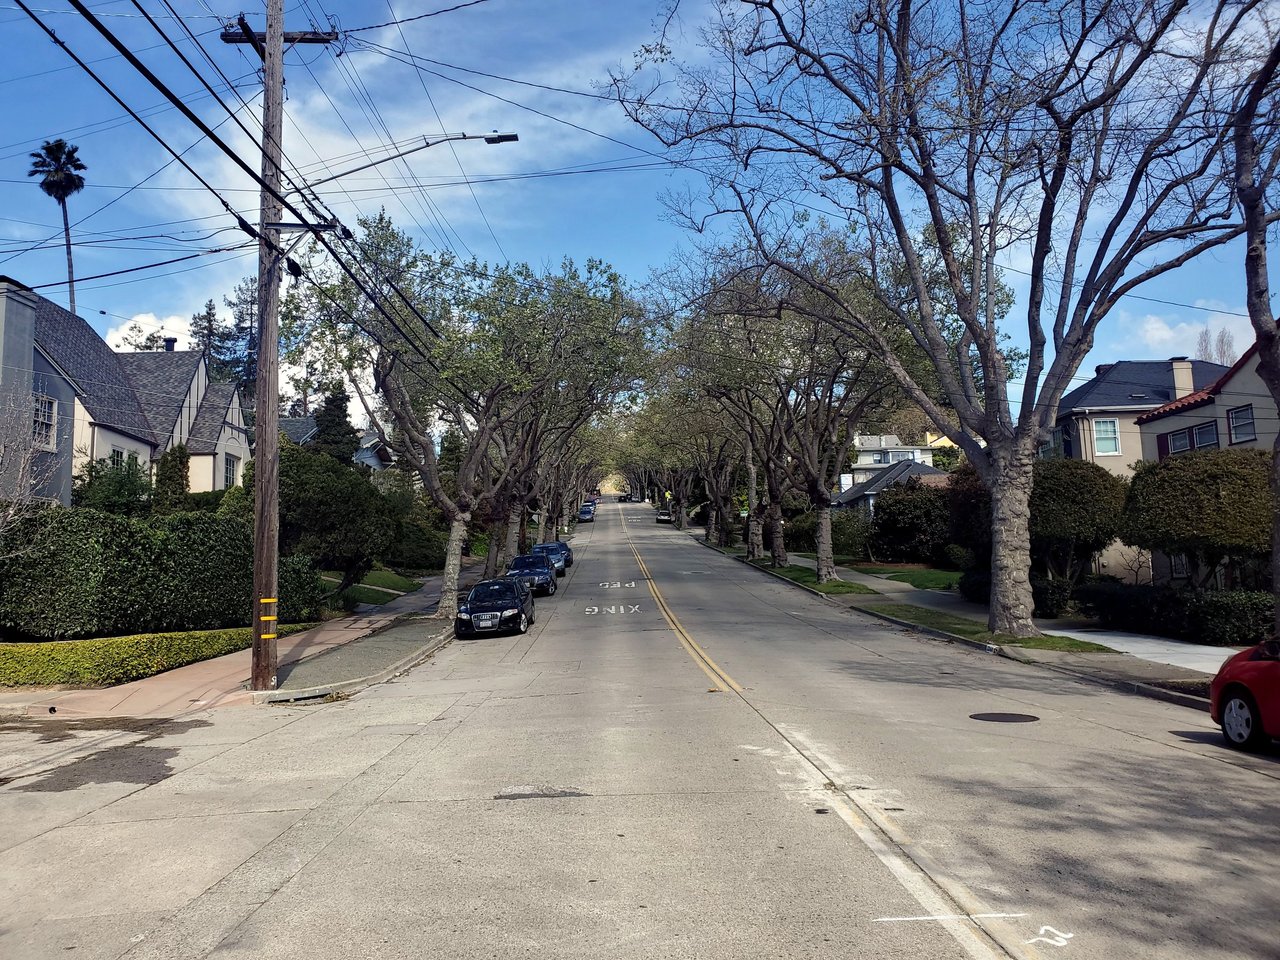
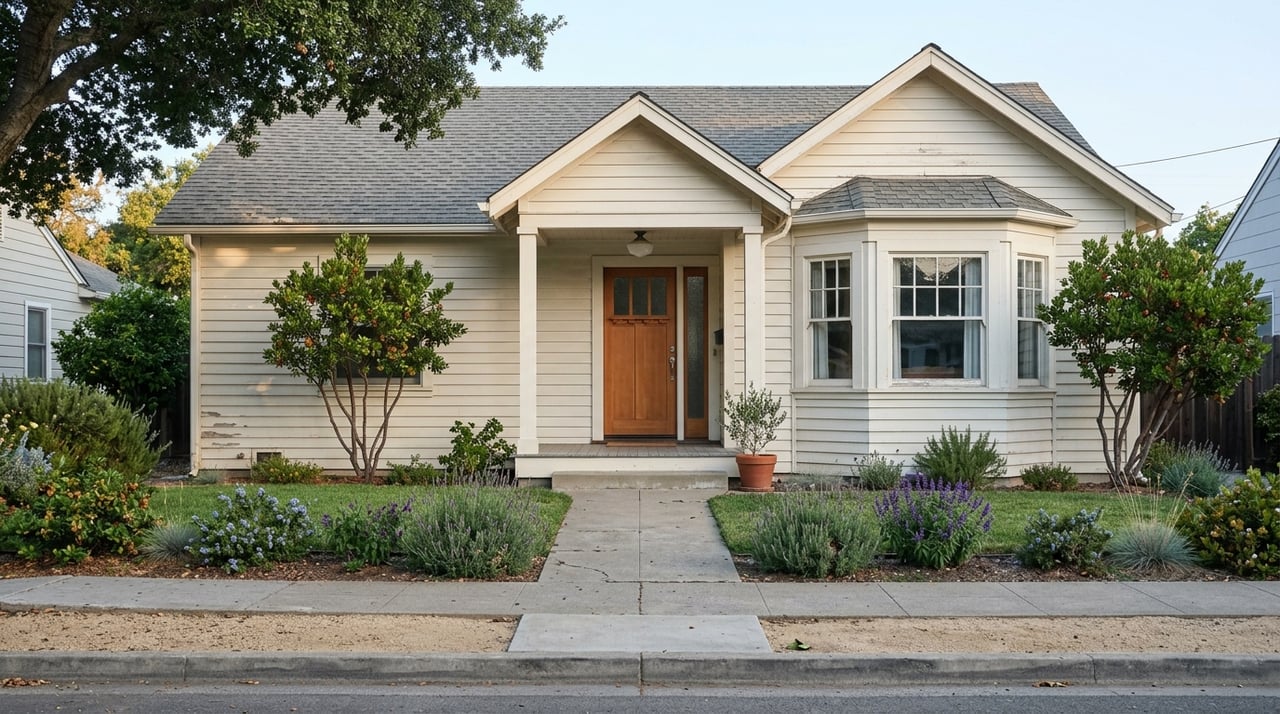
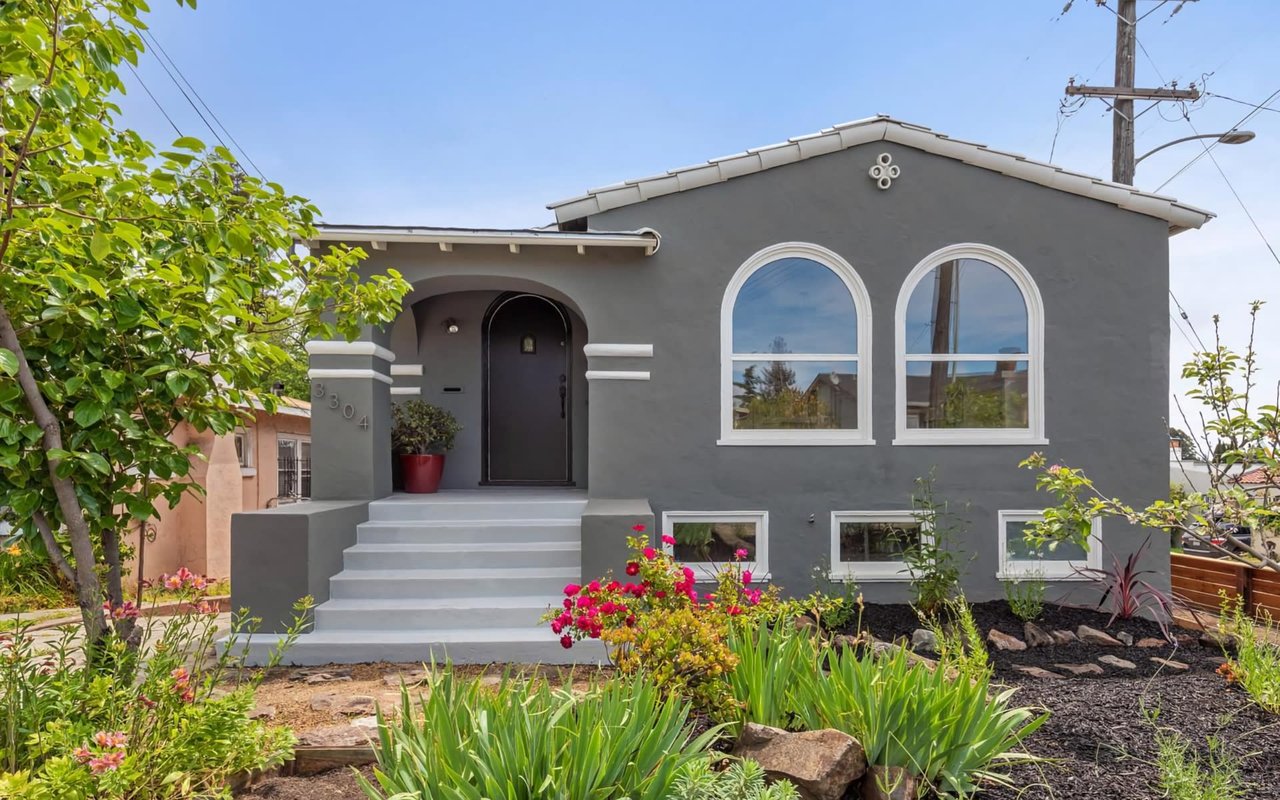
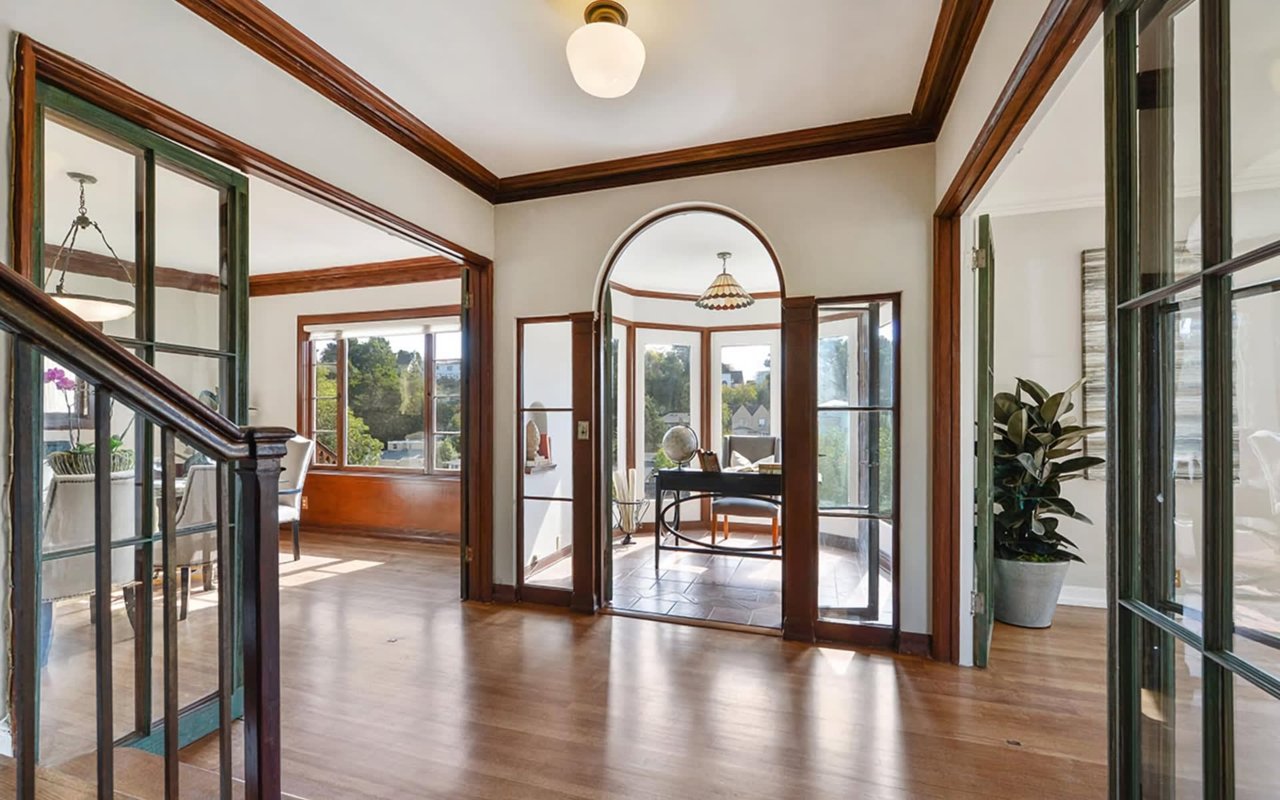
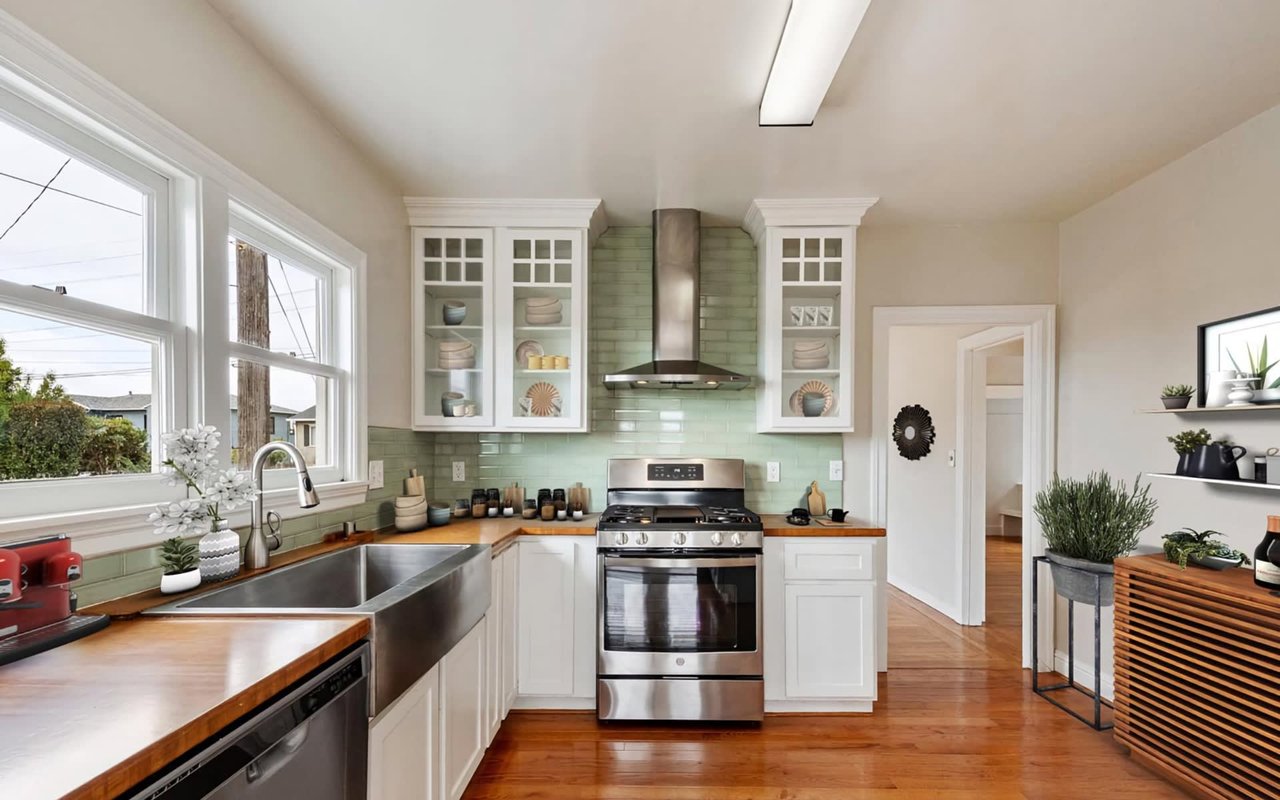
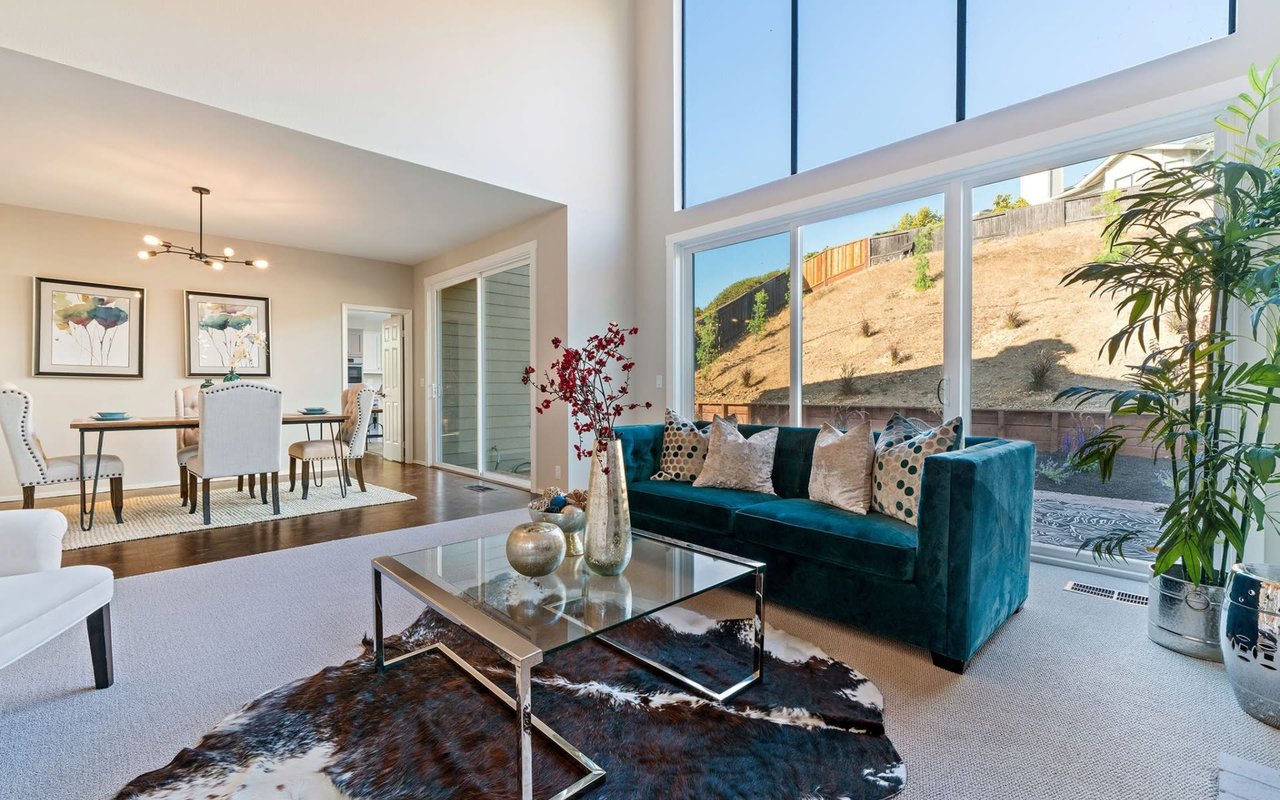
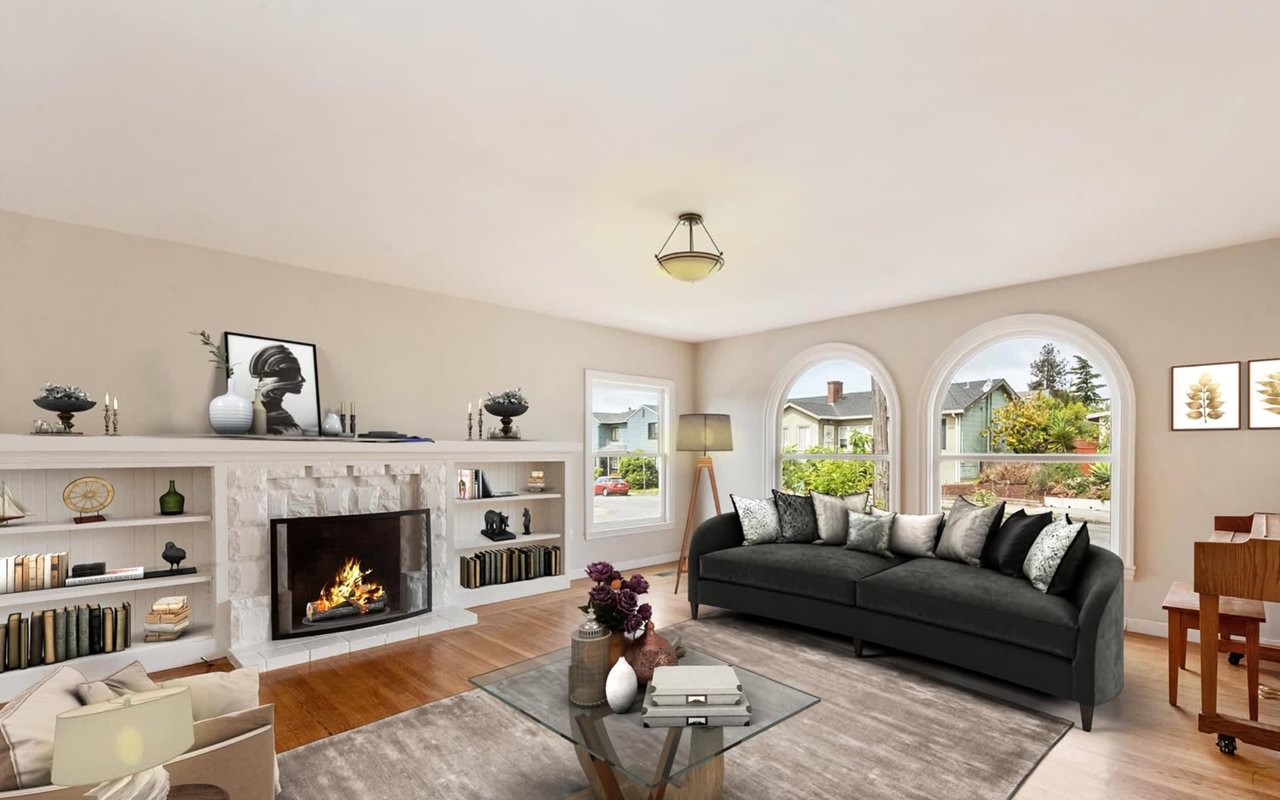
Buyers moving into the East Bay from almost anywhere else hit this in their first weekend of open houses. A house is listed at $1,195,000. It sells for $1,550,000. That is not a mistake, a frenzy, or an agent misjudging the market. It is the regional convention working as designed.
In most of the country, a list price is the seller's opinion of value and offers negotiate down from it. Across much of the inner East Bay, the list price is set deliberately below where the seller and their agent expect the house to trade, to pull a wide field of buyers to a price point that looks reachable, concentrate them on one offer date, and let them establish the value against each other.
Whether you approve of the practice matters less than understanding it. If you screen listings by an upper price limit, you will spend months touring homes you cannot buy and skipping homes you could.
How common it is, market by market
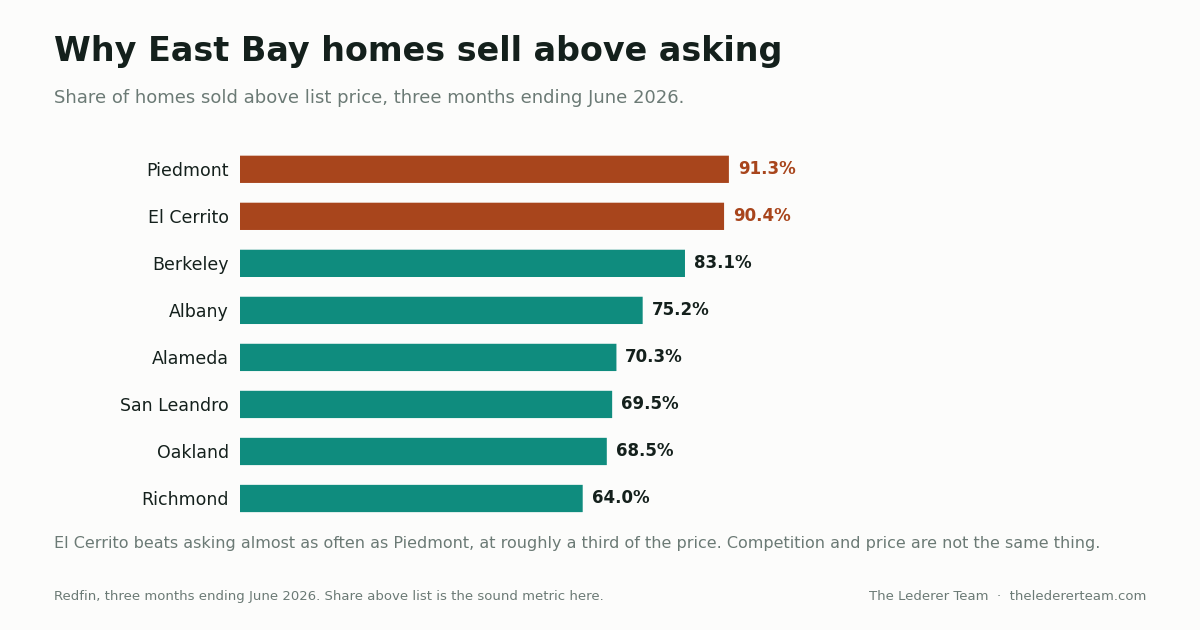
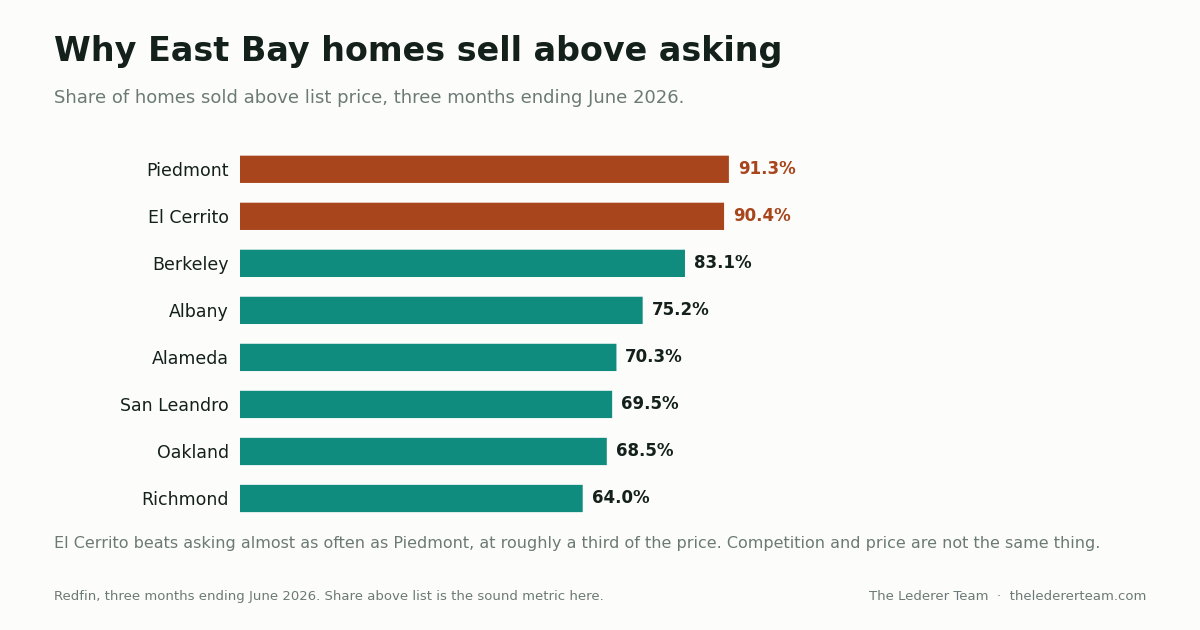
The metric to watch is the share of homes that sold above list. It counts outcomes and does not depend on where the list price was set. Here is where the East Bay stood for the three months ending June 2026, all from Redfin on one methodology.
Market | Share sold above list | Median days on market | Homes sold | Compete Score |
|---|---|---|---|---|
Piedmont | 91.3% | 13 | 46 | 92 |
El Cerrito | 90.4% | 14 | 52 | 95 |
Berkeley | 83.1% | 15 | 228 | 92 |
Albany | 75.2% | 16 | 33 | 89 |
Alameda | 70.3% | 17 | 158 | 87 |
San Leandro | 69.5% | 15 | 127 | 92 |
Oakland | 68.5% | 20 | 805 | 83 |
Richmond | 64.0% | 17 | 207 | 88 |
Contra Costa County | 49.9% | 18 | 992 | — |
Two things stand out. First, in every inner East Bay city listed, selling above asking is the normal outcome rather than the exception. Second, the practice weakens as you move outward: Contra Costa County as a whole sits right at half, which tells you the convention is local, not universal across the Bay.
The Compete Score column is worth a look too. Oakland's 83 matches San Francisco's 83. El Cerrito at 95 and San Leandro at 92 both score higher than Oakland. Buyers who assume competition tracks price level have it backwards.

How far above, and where the number comes from
Share above list tells you how often. The Berkeley Report's second-quarter 2026 numbers, which are MLS-derived, tell you how far.
Berkeley submarket, Q2 2026 | Sales | Median | Sold over list | Average over asking | Active listings |
|---|---|---|---|---|---|
North Berkeley | 36 | $1,800,000 (+22% YoY) | 89% | 37% | 43 |
Berkeley Hills | 72 | $1,726,000 (+7% YoY) | 86% | 32% | 99 |
An average of 32% to 37% over asking is where this post's headline comes from. Berkeley Hills also averaged 21 days on market with only six price reductions across the quarter, which is what a market looks like when almost nothing is mispriced upward.
One honest caveat on North Berkeley's median. The Berkeley Report puts it at $1,800,000 for the quarter. Redfin's June 2026 cut of the same neighborhood came in at $1,599,444. Different sources, different sample definitions, different periods. Treat North Berkeley as a range of roughly $1.60 million to $1.80 million, and be suspicious of anyone quoting one figure to the dollar.

Why I use share above list and not a sale-to-list ratio
This is the part that trips up buyers doing their own research, and it is worth being precise about.
A sale-to-list ratio divides the sale price by the list price. Where the list price represents the seller's opinion of value, that ratio is informative: 98% means buyers negotiated down a little, 103% means there was competition. It is a good metric for the market it was designed for.
Apply the same formula in a market that lists below expected value on purpose and it stops measuring competition. It starts measuring the size of the discount the seller chose. You will see East Bay sale-to-list figures published that look impossible next to any normal market. The arithmetic is correct and nobody is doing anything improper. The formula is answering a different question than the one you are asking, because one of its two inputs is a marketing decision rather than a valuation.
Share of homes sold above list does not have that problem. It counts outcomes: a home either cleared its list price or it did not, regardless of how that price was set. When comparing East Bay markets to each other or to somewhere else, use share above list, days on market and price per square foot. Those three travel well.
A related caution applies when a median moves and price per square foot does not follow. In 2026 both Albany and El Cerrito produced year-over-year medians pointing one way while their price per square foot pointed the other, on small sale counts. That is a mix shift in what happened to close, not a change in value. I work through those cases in the East Bay housing market update.
Where the convention does not apply
Cross the hills and the pricing culture changes. In the first quarter of 2026, per Lamorinda Weekly, single-family sale-to-list averages ran 102.4% in Lafayette, 100.3% in Orinda and 104.2% in Moraga. Those come from a market where list prices sit close to expected value.
Lamorinda, Q1 2026 (averages) | Closings | Average price | Average DOM | Sale-to-list |
|---|---|---|---|---|
Lafayette | 54 | $2,626,037 | 30 | 102.4% |
Orinda | 44 | $2,406,916 | 20 | 100.3% |
Moraga | 21 | $1,964,244 | 14 | 104.2% |
Redfin's share-above-list figures agree: Lafayette 43.5%, Moraga 46.5%, Walnut Creek 40.8% for the three months ending June 2026. Roughly four in ten, against roughly nine in ten in Piedmont and El Cerrito. Same region, opposite conventions, and a buyer needs to switch modes crossing the tunnel.
Alameda is a third case. At 70.3% above list it still follows the inner East Bay pattern, but it is the only major East Bay city showing a declining median, declining price per square foot, lengthening days on market and a falling share above list at once. Where four indicators agree, the bidding dynamic is loosening, and a buyer has more room there than the raw percentage suggests.
How to actually bid in a market like this
- Search by what homes sold for, not by list price. Set your search range meaningfully below your true budget. In Berkeley that can mean shopping listings priced 20% to 30% under your ceiling.
- Get the comparable sales, not the comparable listings. The only reliable read on where a house will land is what similar homes closed at in the last 60 to 90 days.
- Read the disclosure package before you fall in love. Sellers here typically publish inspections up front. The Transfer Disclosure Statement is statutory; the Seller Property Questionnaire is a C.A.R. form most Bay Area sellers also complete rather than a legal requirement, and it is often the most informative document in the stack.
- Know your financing ceiling precisely. The 2026 conforming loan limit for a one-unit property is about $1.25 million in both Alameda and Contra Costa counties. Above that you are in jumbo territory with different underwriting. Confirm the exact figure and your qualification with a lender.
- Model the payment, not just the price. The 30-year fixed averaged 6.65% in the week ending August 20, 2026, per Freddie Mac. A 30% overbid moves your monthly number substantially, which I work through in what a 6.65% rate actually costs you.
- Compete on terms, not only on price. Timeline, contingencies, deposit and rent-back flexibility all carry weight. That is the flip side of how listing agents compare offers, worth reading from the other chair.
Nobody can tell you exactly where a specific house will land, and anyone who promises a number is guessing. What a good agent can do is show you the closed comps, state the range the evidence supports, and let you decide what the house is worth to you. If you want that read before an offer date, call 510-774-4231, email [email protected], or set up a buyer consultation.
Frequently asked questions
Why do Bay Area homes sell so far over asking?
Because sellers list below expected value on purpose. The list price functions as a marketing entry point rather than an opinion of value, drawing a wide field of buyers to a single offer date where they set the price against each other. In North Berkeley, 89% of second-quarter 2026 sales closed above list at an average of 37% over asking, per The Berkeley Report. In the Berkeley Hills it was 86% and 32%.
How much over asking should I offer on an East Bay home?
There is no fixed percentage, and any agent quoting you one without looking at comparable sales is guessing. Averages give you a starting frame: North Berkeley averaged 37% over asking and the Berkeley Hills 32% in the second quarter of 2026. The right number for one house comes from what similar homes closed at in the last 60 to 90 days, plus how the seller weighs your terms.
Is the sale-to-list ratio a reliable East Bay statistic?
Not on its own. The formula divides sale price by list price, so in a region where list prices are deliberately set below expected value, it partly measures the seller's pricing choice rather than buyer competition. The arithmetic is correct, but it answers a different question. Share of homes sold above list, days on market and price per square foot are the metrics that compare cleanly across markets.
Do all East Bay homes sell above asking?
No, and the variation is large. For the three months ending June 2026, Redfin data shows 91.3% of Piedmont sales and 90.4% of El Cerrito sales closing above list, but only 49.9% across Contra Costa County. Over the hill in Lamorinda, Lafayette was 43.5% and Moraga 46.5%. The underpricing convention is strongest in the inner East Bay and fades as you move outward.
How should I set my home search budget in Berkeley or Oakland?
Search well below your actual ceiling. If Berkeley homes routinely close 30% or more above list, a search capped at your maximum price shows you almost nothing you can win. Work backward instead: decide the closing price you can support at current rates, then shop listings priced meaningfully under it. Confirm your financing limits with a lender first, particularly around the roughly $1.25 million conforming loan line.
Sources
- Redfin city market data and Compete Scores, three months ending June 2026 — link
- The Berkeley Report, Q2 2026, MLS-derived neighborhood statistics
- Lamorinda Weekly single-family closings, January 1 to March 31, 2026 — link
- Freddie Mac Primary Mortgage Market Survey, week ending August 20, 2026 — link
- 2026 conforming loan limits, Alameda and Contra Costa counties (confirm with your lender)
Mark Lederer leads The Lederer Team at Red Oak Realty and has closed more than 1,000 East Bay transactions across 25 years, on both sides of the offer table. If you are trying to figure out what a specific house will actually take, call 510-774-4231 or email [email protected].