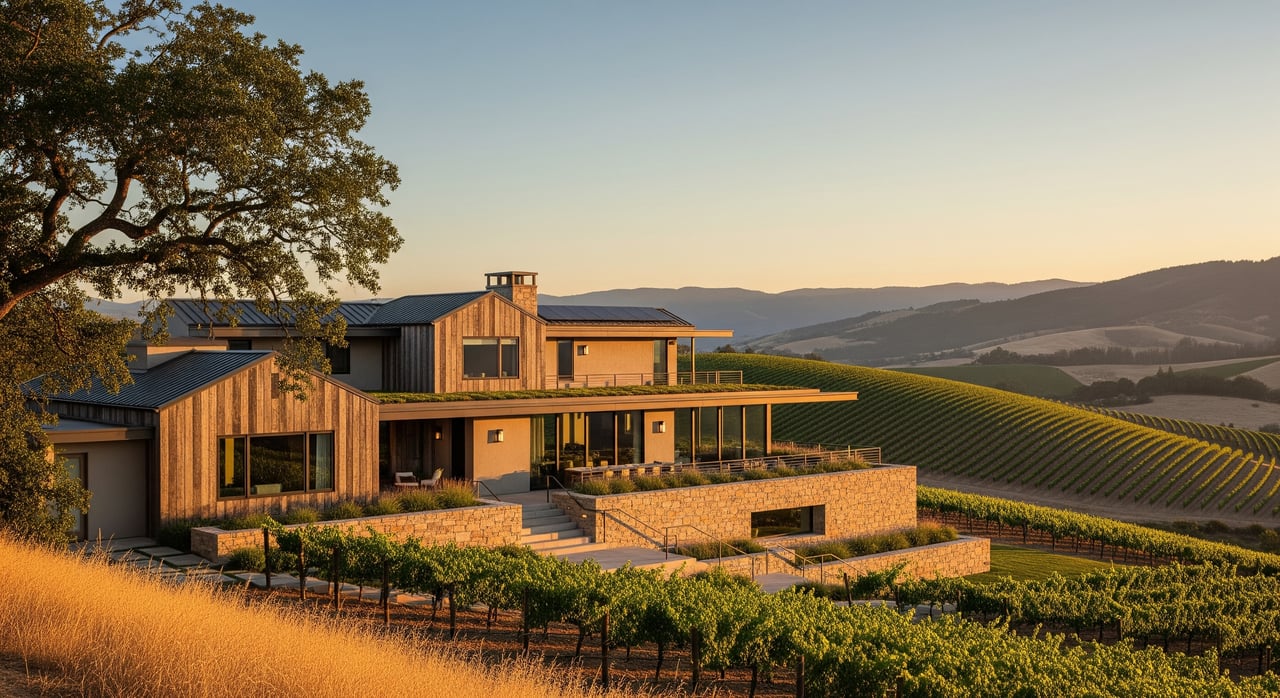
Short version: In August we argued that AI hiring in San Francisco would push housing demand across the Bay. A full twelve months of closed sales says the demand was real, and it went the opposite way from the one we expected. It concentrated close in. The cities inside ten miles of downtown San Francisco took nearly all of the year's price growth, and the BART-commute suburbs we flagged saw more transactions without higher prices per square foot. We have published the whole analysis as a page we will update every quarter.

Why we went back and checked our own call
Six months ago we published a piece on how the AI boom is reshaping the East Bay. It argued that AI companies signing ten-year San Francisco office leases would generate housing demand that San Francisco's own supply could not absorb, that the record rent gap between San Francisco and Oakland would push people east, and that recovering BART ridership made the commute viable again. It put a two-to-three year clock on the repricing.
That was a forecast. Forecasts should be checked, and most real estate forecasts never are. So we checked it.
We pulled every closed sale in Alameda, Contra Costa, San Francisco, San Mateo, Santa Clara, Marin, Solano, Sonoma and Napa counties for the twenty-four months ending July 2026. That is 100,076 sales. We compared the most recent twelve months against the twelve before, city by city. Full years on both sides, so seasonality cancels out exactly. Price per square foot rather than median price, for reasons that turn out to matter more than usual this year.
What the year actually shows
Across all nine counties the median house sold for 1.5% less per square foot than the year before. Condos fell 3.1%. Underneath that flat-looking regional number is one of the sharpest geographic patterns we have seen in this data.
Distance from downtown San Francisco | Change in median price per sq ft |
|---|---|
0–5 miles | +11.7% |
5–10 miles | +3.5% |
10–15 miles | −1.7% |
15–20 miles | −0.7% |
20–25 miles | −2.5% |
25–30 miles | −3.7% |
30–40 miles | −5.6% |
40–60 miles | −4.0% |
Essentially every dollar of appreciation in the nine-county Bay Area happened within ten miles of downtown San Francisco. Past that ring, the further out you go, the worse the year was.
Where the call held up
The core claim holds. San Francisco is where the money landed, and it landed hard: houses in the city rose 11.7% per square foot on 1,452 sales, the largest gain of any market of real size in the region. San Francisco condos rose 6.5% on 2,538 sales while condos regionally fell 3.1%. That is a bid.
The close-in East Bay caught it too. Piedmont finished up 15.0%, third of the 106 cities we can rank. El Cerrito rose 7.1%, Berkeley 6.4%, Oakland 2.1%. All positive in a year when the region was negative, and all within ten miles of the city.
# | City | County and distance |
| Change | Sales |
|---|---|---|---|---|---|
1 | Corte Madera | Marin County · 11 mi |
| +20.0% | 78 |
2 | Forestville | Sonoma County · 54 mi |
| +16.9% | 63 |
3 | Piedmont | Alameda County · 9 mi |
| +15.0% | 125 |
4 | San Francisco | San Francisco County · 2 mi |
| +11.7% | 1452 |
5 | Hillsborough | San Mateo County · 15 mi |
| +11.6% | 132 |
6 | Woodside | San Mateo County · 26 mi |
| +11.2% | 85 |
7 | Atherton | San Mateo County · 26 mi |
| +10.5% | 82 |
8 | Mountain View | Santa Clara County · 33 mi |
| +7.2% | 221 |
9 | El Cerrito | Contra Costa County · 10 mi |
| +7.1% | 173 |
10 | American Canyon | Napa County · 27 mi |
| +6.9% | 69 |
Read the small ones carefully. Corte Madera, Forestville and American Canyon each closed fewer than 80 houses this year. At that volume a couple of unusual sales moves the figure several points, so treat those positions as a neighbourhood rather than a placing. The pattern the whole table sits inside, strength close to San Francisco, rests on 37,108 sales and is far firmer than any single row in it.
The different story price per square foot shows
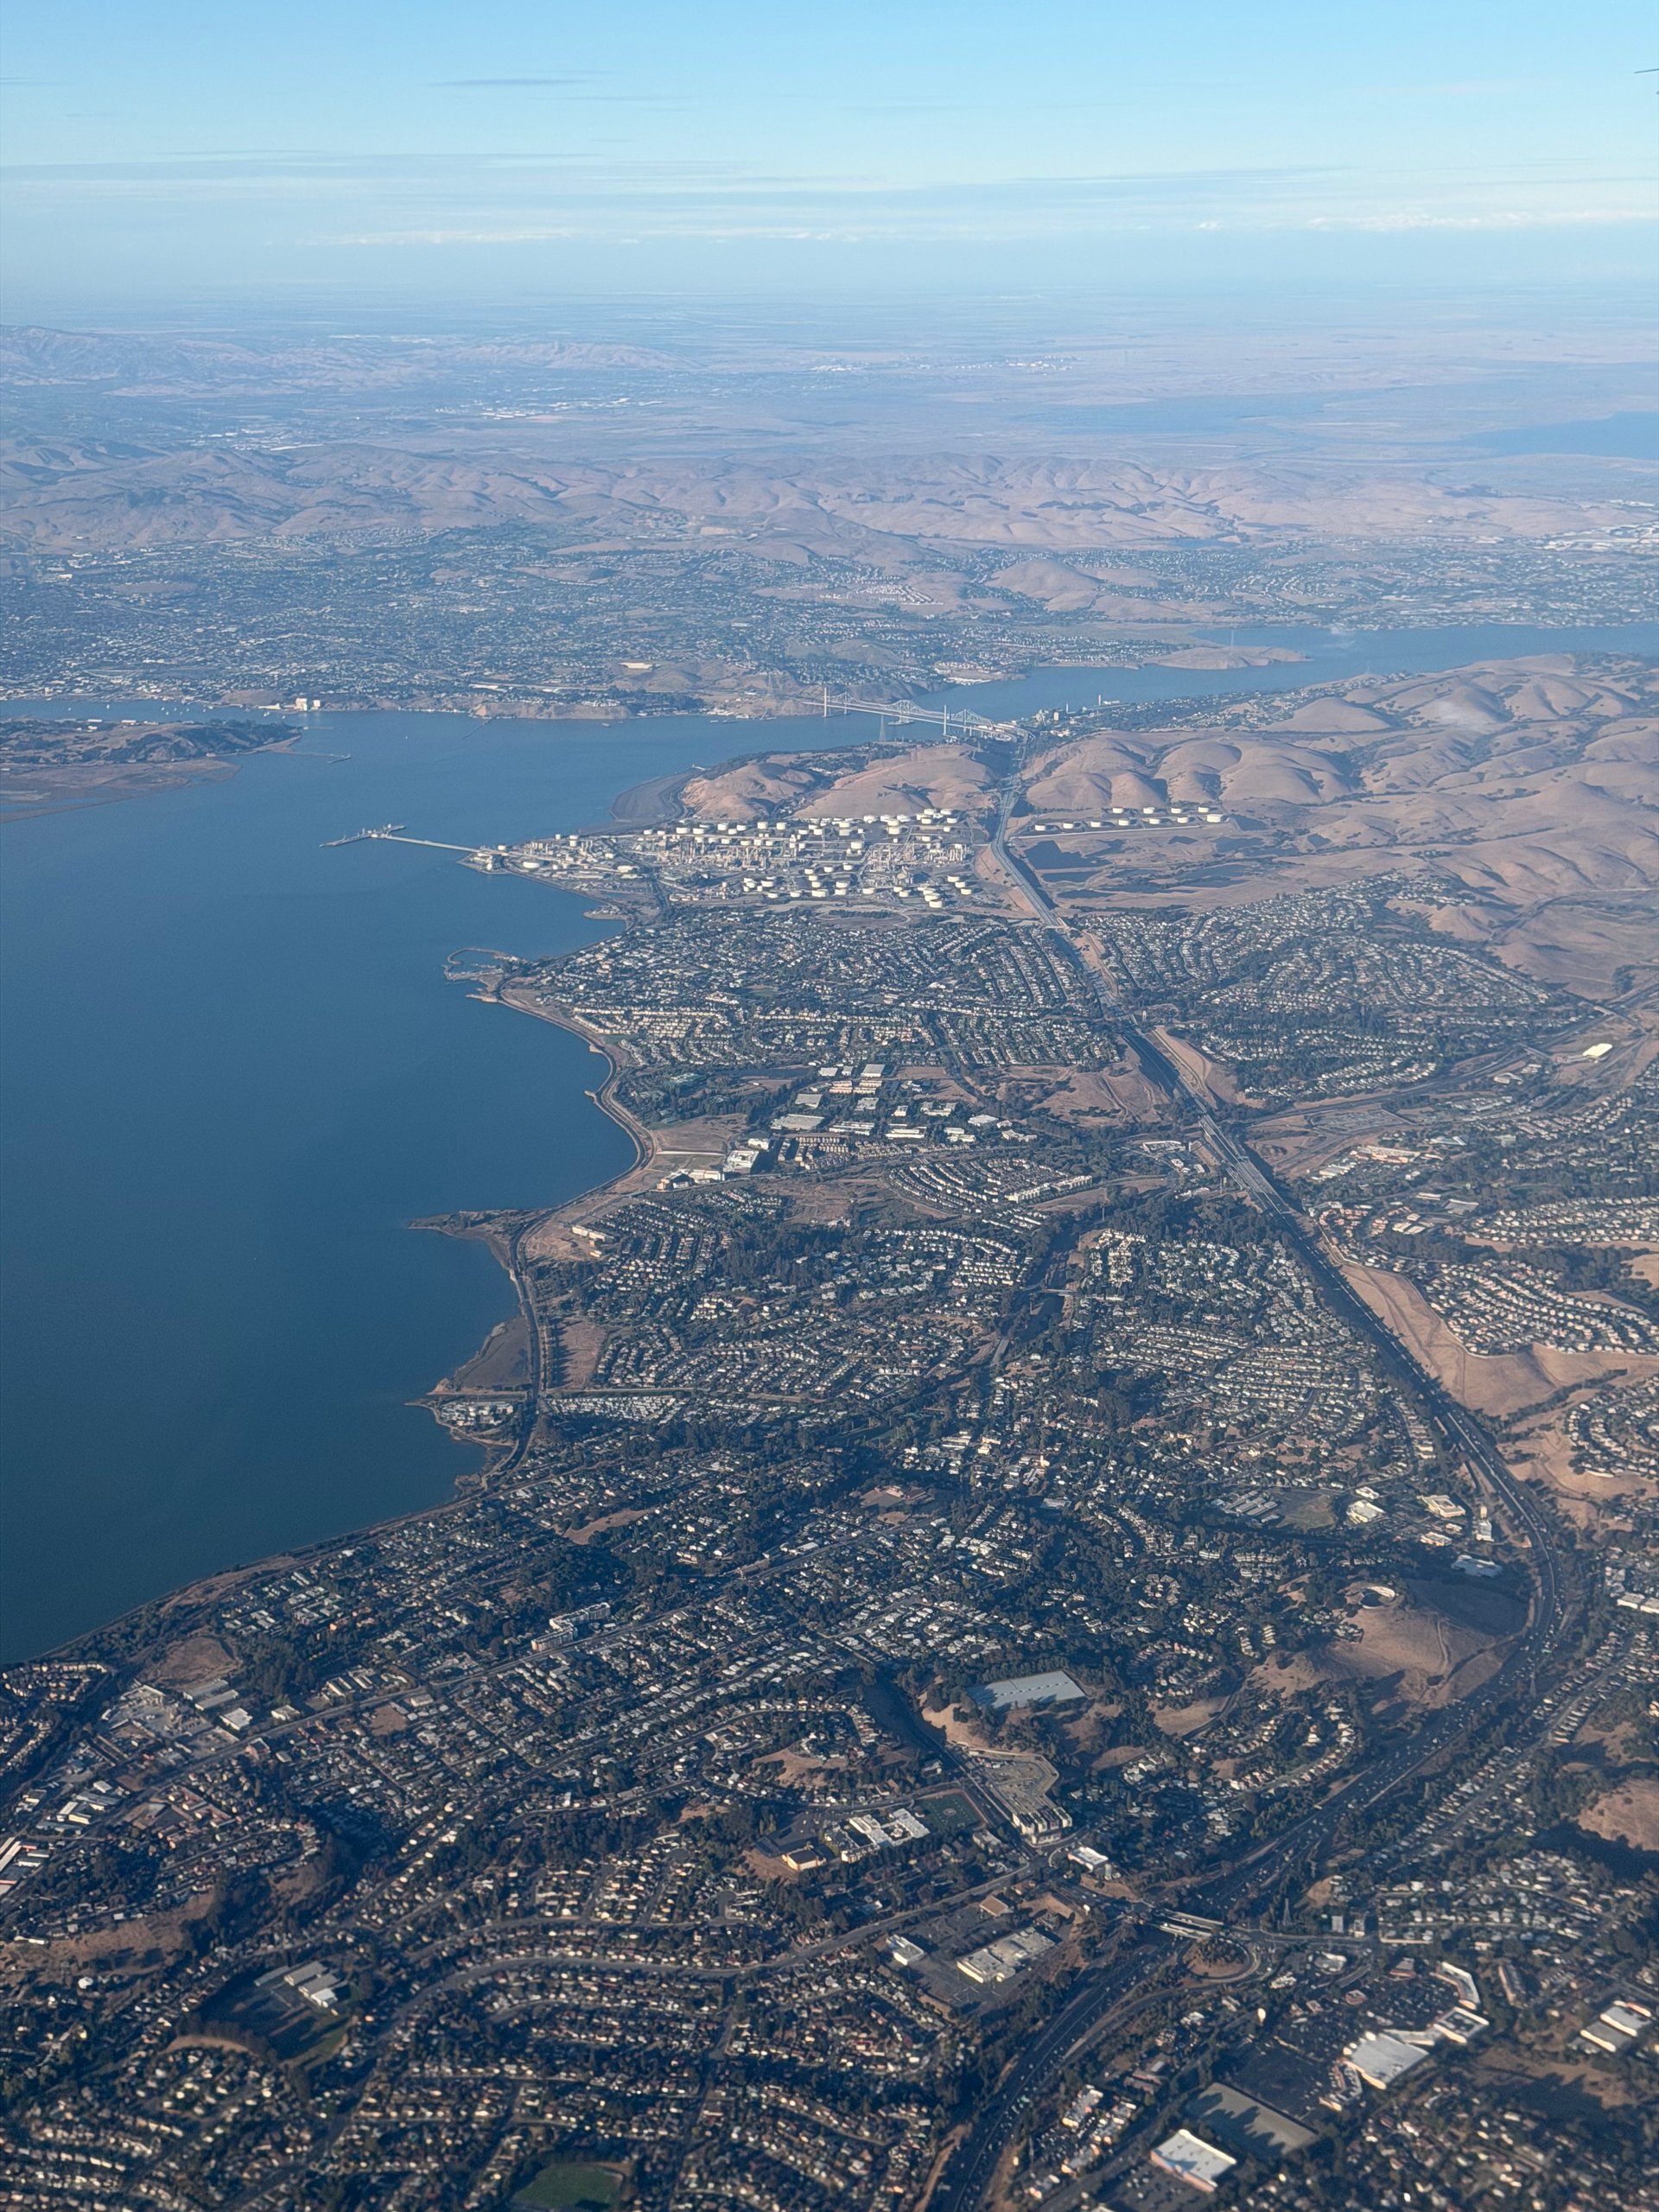
We pointed at the outer East Bay. The August piece noted sales activity jumping in Lafayette, San Ramon, Walnut Creek, Moraga and Orinda, and read that as demand moving out along BART. The activity was real. The price growth was not.
City | Miles from SF | Change in median price per sq ft |
|---|---|---|
Moraga | 15.0 | +0.8% |
Walnut Creek | 19.9 | +0.3% |
Danville | 21.9 | −1.8% |
Lafayette | 16.6 | −2.6% |
Orinda | 13.3 | −4.9% |
San Ramon | 23.1 | −5.6% |
Dublin | 26.1 | −9.5% |
More houses changed hands in that corridor, and buyers did not pay more per square foot for them. If AI money is moving east, it has so far bought in Piedmont and Berkeley. Lamorinda and the Tri-Valley have not seen it. The honest reading is that the demand is real and its range is much shorter than we assumed. About ten miles.
One more correction worth making plainly. The August piece cited Lafayette's median sale price up 20% year over year. Measured across a full twelve months in price per square foot, Lafayette is down 2.6%. Both figures are arithmetically correct. Only one of them is about the market.
The full analysis covers 106 ranked house markets and 59 condo markets across nine counties. The pattern in one line:
Every city, searchable, with its rank, median price, days on market and how far below the sale price homes are listed.

Why we decided to look at price per square foot
A median sale price tells you what the middle house that sold went for. It moves when the market moves, and it also moves when a different sort of house happens to sell. In a thin year, the second effect can be larger than the first.
El Cerrito is the cleanest example in the whole dataset. Its median sale price fell from $1,250,000 to $1,200,000, down 4.0%. On that number, El Cerrito had a bad year. But the median house that sold there shrank from 1,722 square feet to 1,500. Once you account for that, the median price per square foot rose from $722 to $774, up 7.1%, ninth best of 106 cities. El Cerrito had a good year. Smaller houses sold, and every one of them sold dearer.
Orinda runs the same effect in reverse. Median sale price up 4.5%, from $1,845,000 to $1,928,000. Price per square foot down 4.9%, from $822 to $782. A seller told "Orinda is up four and a half percent" is being handed a number about which houses sold. It says nothing about what they were worth.
That difference decides a list price, and a list price decides whether you get offers in the first ten days or watch the listing sit.
What this means if you are selling
If you are inside the ten-mile ring (San Francisco, Piedmont, Berkeley, El Cerrito, Albany, north Oakland), you are in the part of the region that gained ground this year, and the comparable sales from last spring understate what your home is worth today. Pricing off those comps leaves money on the table.
If you are outside twenty miles, the opposite is true, and it is the harder conversation. The market moved down beneath you. A list price anchored to what your neighbour got eighteen months ago will produce a slow listing and a price reduction, which costs more than starting at the right number would have.
Either way the instruction is the same. Find out what your city actually did before you decide what your house is worth. The regional number will not tell you, and neither will a portal estimate.

The page, and why it is public
We have put the whole analysis on our site: the Bay Area Home Price Map. Every city we can measure, on a map, colored by how it moved. All 106 ranked house markets and 59 condo markets, sortable. The ten strongest markets in each region. Every city plotted against its distance from San Francisco. And a search box, so you can find your own city in about four seconds.
We will update it every quarter. That means the next refresh will also be a second test of the thesis above, and if the outer East Bay starts pricing the way we expected, the page will show it before we do.
Making it public costs us nothing we want to keep. The service is knowing what to do with the analysis, and that part does not fit on a page.
What would change our mind
Three things we are watching, in order of how much they would move us.
The first is the ten-mile ring widening. If the 10–15 and 15–20 mile bands turn positive next quarter while the inner ring cools, the original thesis was right and simply slower than we said. That is the outcome we would expect if the repricing really runs on a two-to-three year clock.
The second is return to office softening. The whole argument rests on those ten-year leases meaning people in chairs. If the large AI employers move to three days a week or fewer, distance stops costing what it currently costs, and the ring flattens.
The third is small-market noise. Some of the cities at the top of our table are thin. Corte Madera led the region at +20.0% on 78 sales; Forestville came second at +16.9% on 63. Markets that small move on a handful of houses, and we would not price a home off either figure. The ring pattern holds across 37,108 house sales, which is why we trust the shape of it more than any single city in it.
Frequently asked questions
Why price per square foot instead of median price? Because a median moves when the mix of homes that sell changes, and price per square foot largely does not. See El Cerrito above, where the two measures disagree by eleven points in the same city in the same year.
Why full twelve-month periods? So seasonality cancels exactly. Every spring and every winter appears once on each side of the comparison. We see this constantly in published market reports: a spring quarter compared against a fall quarter, and the difference reported as appreciation. It usually is not.
Does this tell me what my house is worth? No. It tells you what your city did. Condition, block, floor plan and timing move a single property far more than its city's median does. The city number is where a valuation starts. Everything after that is about your particular house.
How many cities are ranked, and why not all of them? A city needs at least 40 sales in the recent year and 25 in the prior year to be ranked; 106 clear that bar for houses and 59 for condos. Below it, the figure is reported without a rank. Below 15 sales we do not report it at all, because it would not mean anything.
Analysis by The Lederer Team at Red Oak Realty, from Bay Area MLS closed sales, August 2025 through July 2026 against the twelve months prior. Not an appraisal. For a read on a specific home, ask us or call 510-774-4231.