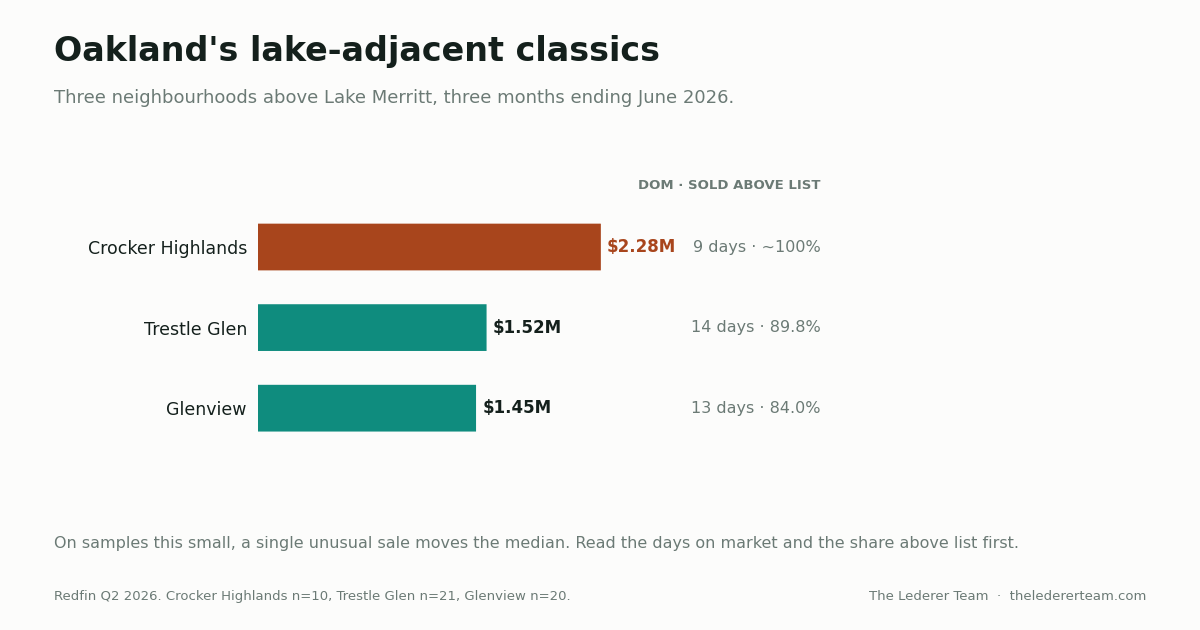
Short answer: Crocker Highlands ran a $2,279,207 median over the three months ending June 2026, per Redfin, with a 9-day median time on market and close to every one of its sales closing above list. That was on ten sales, which is a small sample and should be read as one. Trestle Glen and Glenview sit a full price tier below it.
The three, side by side
Neighborhood | Median sale | YoY | Median DOM | % sold above list | Homes sold |
|---|---|---|---|---|---|
Crocker Highlands | $2,279,207 | −0.9% | 9 | ~100% | 10 |
Trestle Glen | $1,519,471 | +11.7% | 14 | 89.8% | 21 |
Glenview | $1,449,496 | +11.1% | 13 | 84.0% | 20 |
Oakland, citywide | $898,511 | +5.7% | 20 | 68.5% | 805 |
All figures are Redfin, three months ending June 2026. The pattern is consistent: all three neighborhoods sell faster than Oakland as a whole and a far higher share of them clear asking. Glenview at 84% above list against a citywide 68.5% is the honest measure of how much more competitive these pockets are.
Note that I am using percent of homes sold above list rather than a sale-to-list ratio. Redfin's East Bay sale-to-list figures run high enough to be an artifact of the region's underpricing convention rather than a real measure. Share above list is the sound metric.
What ten sales can and cannot tell you
Crocker Highlands closed ten sales in the period. Trestle Glen closed 21 and Glenview 20. Those are thin, and thin samples produce dramatic-looking year-over-year numbers that mostly describe which houses happened to sell.
Crocker Highlands showing −0.9% while Trestle Glen shows +11.7% is not evidence that one neighborhood outperformed the other. On ten transactions, one large estate sale or its absence moves the median more than a year of market direction does. Use the days-on-market and share-above-list columns instead. Those hold up better at small sample sizes, and they say all three are tight.
The citywide figure carries its own caution. Redfin has Oakland up 5.7% year over year; Zillow's home value index had Oakland down 8.8% as of February 2026. Those point in opposite directions, and anyone citing an Oakland year-over-year number without disclosing that split is giving you half the story.
Supply context: Oakland had 0.92 months of supply with new listings down 35% year over year in January 2026, per Houzeo via JVM Lending. That is the oldest figure I am using here, so treat it as a January reading, not a current one. Oakland's Redfin Compete Score of 83 equals San Francisco's 83.
Why buyers compare these to Piedmont
Crocker Highlands borders Piedmont, and most buyers looking at one look at the other. The numbers are not close. Piedmont's median was $3,198,260 over the three months ending June 2026, up 15.3%, at $1,260 per square foot, with 91.3% of its 46 sales above list.
Two things sit behind that gap. Piedmont High ranked 17th of 2,162 California public high schools per SchoolDigger for 2024-25, and Niche's 2026 rankings put it first of 81 public high schools in Alameda County. Piedmont is also its own city, providing its own police, fire, parks and recreation, on 1.7 square miles entirely surrounded by Oakland.
The offset is a line item most comparisons skip. Piedmont's Measure H passed June 2, 2026 with about 80% of the vote: $3,174 per parcel annually, inflation-adjusted, continuing until voters end it, raising roughly $12 million a year. That is on top of ad valorem property tax, and earlier parcel measures remain in force. A buyer weighing Crocker Highlands against a Piedmont house a few hundred feet away should put that number in the monthly math. More on the city itself in the Piedmont guide.
On the Oakland side, school assignment runs by attendance area within Oakland Unified and varies by address. I do not have verified district-level ratings I am willing to publish, so confirm any specific school with the district directly rather than trusting a listing remark.
The $2 million line in Oakland's transfer tax
Oakland's city transfer tax is tiered, and one of its thresholds sits right where Crocker Highlands trades.
Sale price | Oakland city rate per $1,000 |
|---|---|
Up to $300,000 | $10.00 |
$300,000 to $2,000,000 | $15.00 |
$2,000,000 to $5,000,000 | $17.50 |
Over $5,000,000 | $25.00 |
Alameda County's documentary transfer tax of $1.10 per $1,000 applies on top. A Crocker Highlands sale near the neighborhood's median sits in the $17.50 band rather than the $15.00 band, while a typical Trestle Glen or Glenview sale sits in the $15.00 band. Have your title officer run the exact figure for your price before you plan around it, and remember that who pays transfer tax is a negotiated term.
The lake is the amenity
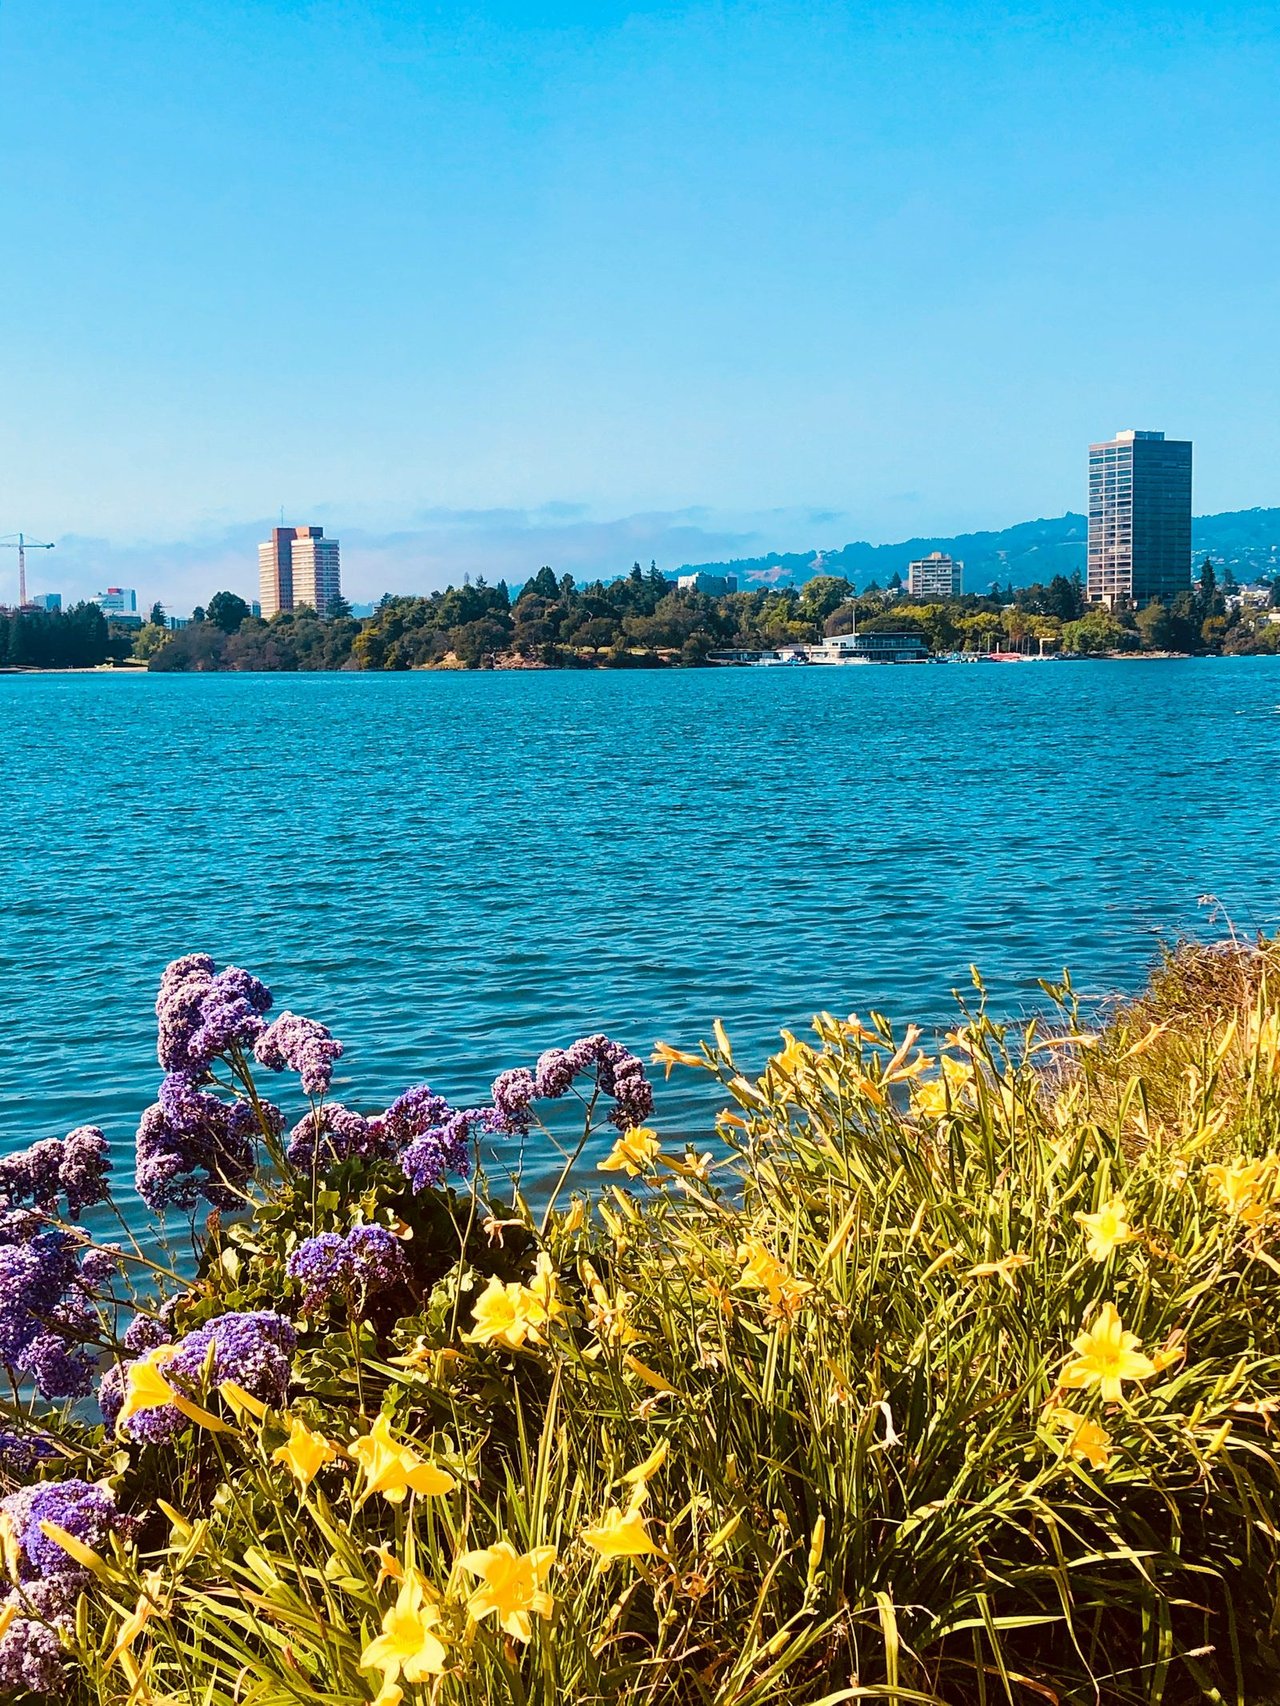
What these three neighborhoods share is walking distance to Lake Merritt, and the lake's history is better than its reputation. It covers 155 acres with a 3.4-mile circumference, and it became the first official wildlife refuge in the United States in 1870, a tidal arm of the Bay stabilized by Samuel Merritt's 1868 dam. It was named a National Historic Landmark as the Lake Merritt Wild Duck Refuge on May 23, 1963.
The Necklace of Lights, 126 lampposts carrying 3,400 bulbs, was first lit in 1925, taken down during the WWII blackouts, and restored in 1987.
Buyers who want the same era of housing higher up should compare the Montclair Village guide. For those weighing walkable commercial districts instead, the Rockridge and Elmwood comparison covers the College Avenue corridor.
Frequently asked questions
How much do homes cost in Crocker Highlands?
Crocker Highlands had a $2,279,207 median over the three months ending June 2026, per Redfin, on ten sales. That is a small sample, so treat it as an indication of tier rather than a precise number. The more durable signals from the same period are a 9-day median time on market and close to every sale closing above the asking price.
Is Trestle Glen or Glenview cheaper?
Glenview, slightly. Redfin put Glenview at a $1,449,496 median and Trestle Glen at $1,519,471 for the three months ending June 2026, on 20 and 21 sales. Both sold well above the Oakland citywide median of $898,511, and both moved faster than the city as a whole. On samples of about twenty, that gap is narrow enough to close in any given quarter.
How competitive are these Oakland neighborhoods?
Very. For the three months ending June 2026, roughly all Crocker Highlands sales, 89.8% of Trestle Glen sales and 84.0% of Glenview sales closed above list, against 68.5% citywide. Median days on market ran 9 to 14 against 20 for Oakland overall. Oakland's Redfin Compete Score of 83 matches San Francisco's.
What transfer tax will I pay selling near Lake Merritt?
Oakland charges $15.00 per $1,000 from $300,000 to $2,000,000 and $17.50 per $1,000 from $2,000,000 to $5,000,000, with Alameda County's $1.10 per $1,000 on top. Homes at the Crocker Highlands median cross into the higher band; most Trestle Glen and Glenview sales do not. Confirm the exact calculation with your title officer.
How does Crocker Highlands compare to Piedmont?
Piedmont costs considerably more, at a $3,198,260 median for the three months ending June 2026 against $2,279,207 in Crocker Highlands, per Redfin. Piedmont buys a top-ranked school district and its own city services. It also carries Measure H, passed June 2026, at $3,174 per parcel annually on top of property tax. Confirm current parcel taxes with the city.
Sources
- Redfin, neighborhood and city data, three months ending June 2026 — link
- Zillow home value index, Oakland, February 2026 — link
- Houzeo via JVM Lending, Oakland supply, January 2026
- SchoolDigger 2024-25 and Niche 2026 rankings — link
- City of Oakland transfer tax; Alameda County Clerk-Recorder — link
- City of Piedmont, Measure H, June 2, 2026
Mark Lederer leads The Lederer Team at Red Oak Realty, with 25 years and more than 1,000 closed East Bay transactions. Whether you are trying to win one of the roughly ten houses a quarter that trade in Crocker Highlands or deciding what yours would bring, call 510-774-4231, email [email protected], start a conversation or get a valuation.