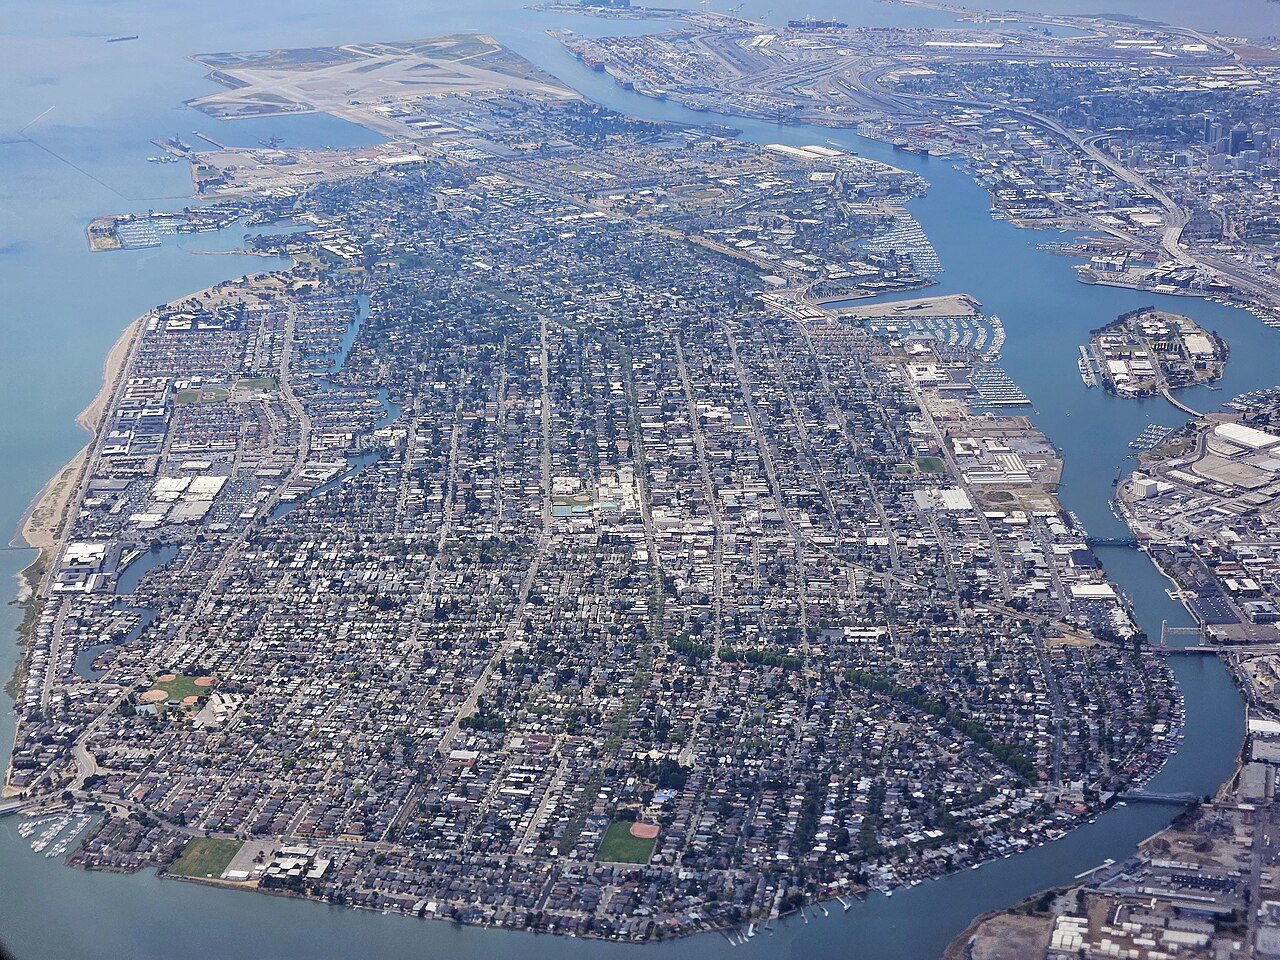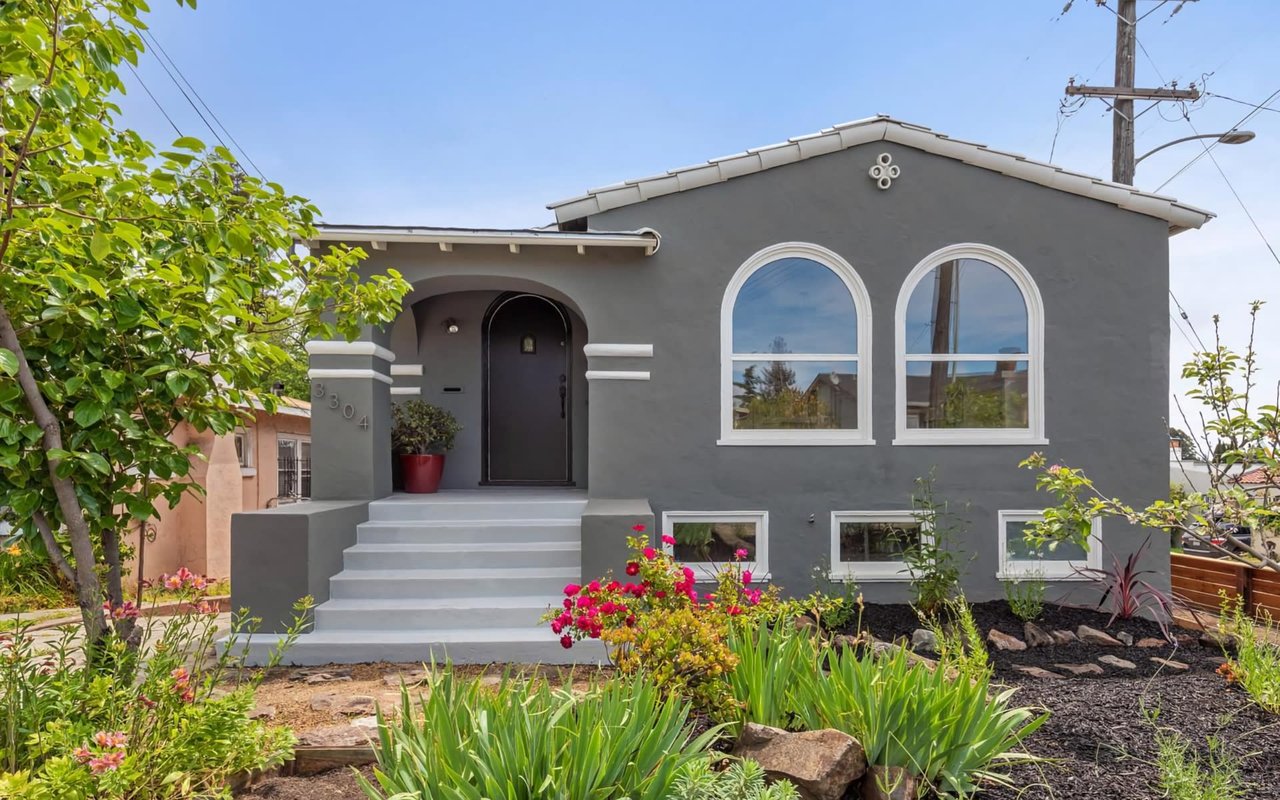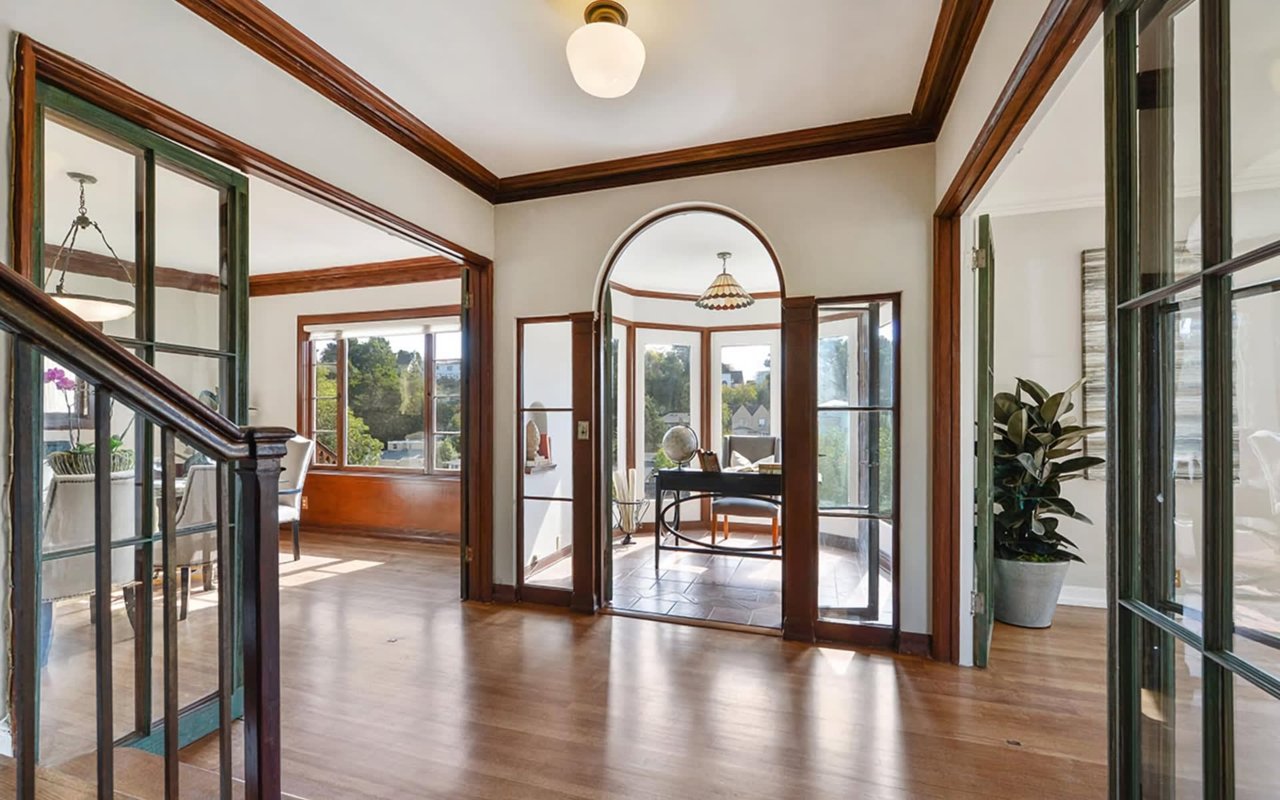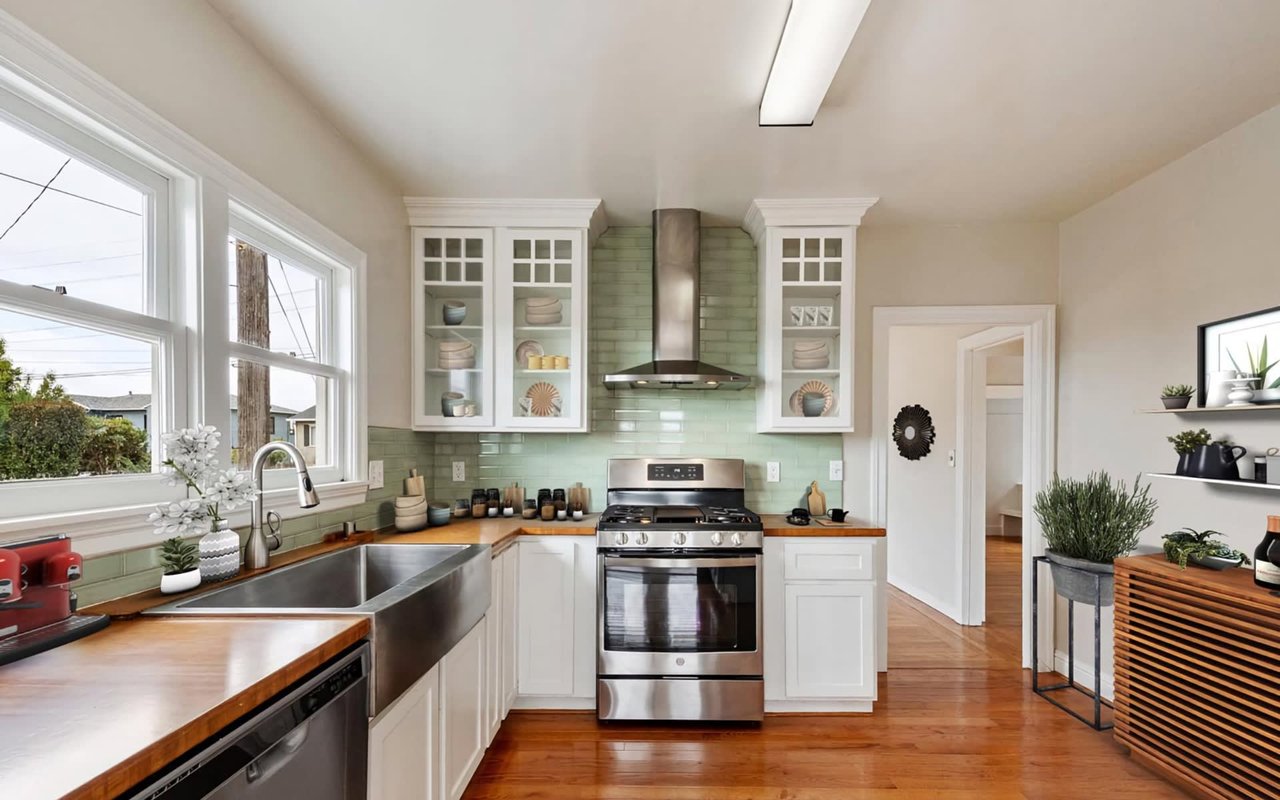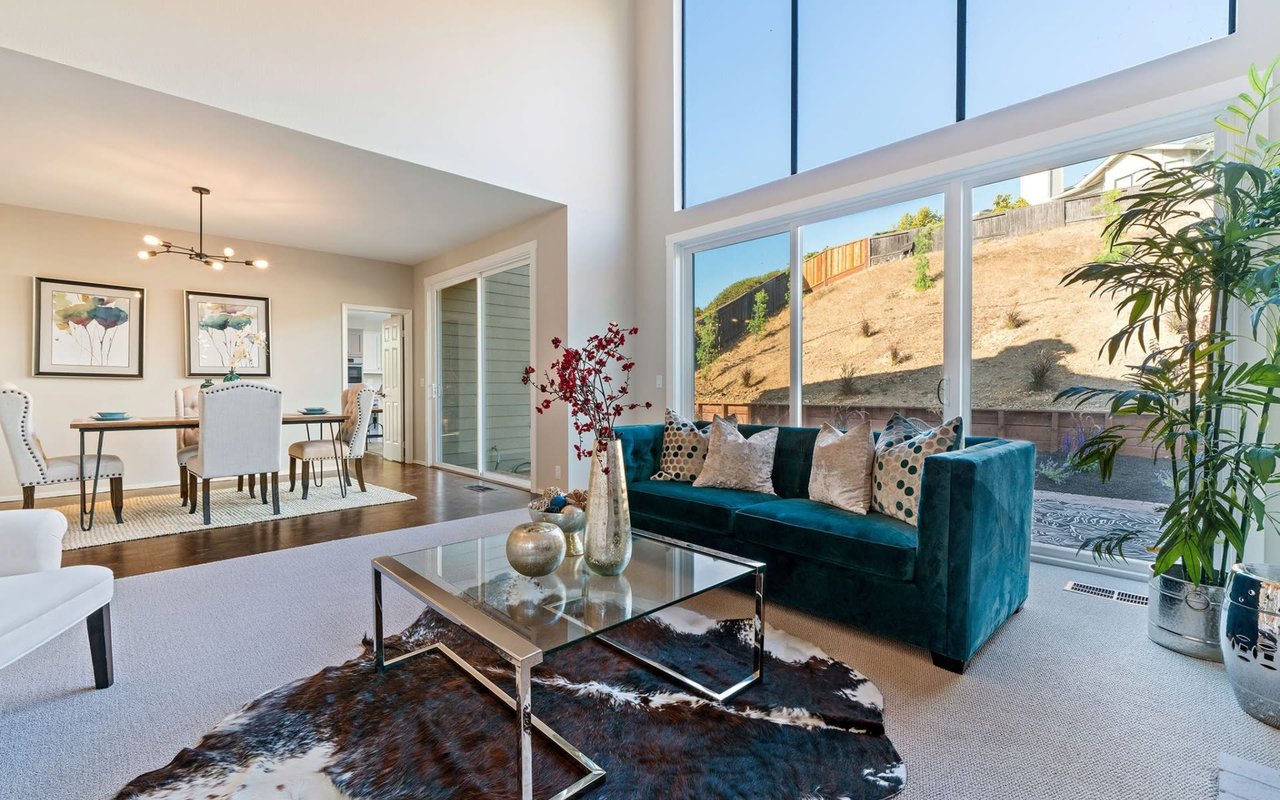
Short answer: San Leandro carries a Redfin Compete Score of 92, higher than Oakland and San Francisco, which both score 83. Over the three months ending June 2026, its median sale was $888,017, up 3.3% year over year, with 69.5% of homes selling above list in a median of 15 days across 127 sales.
The number that makes the case
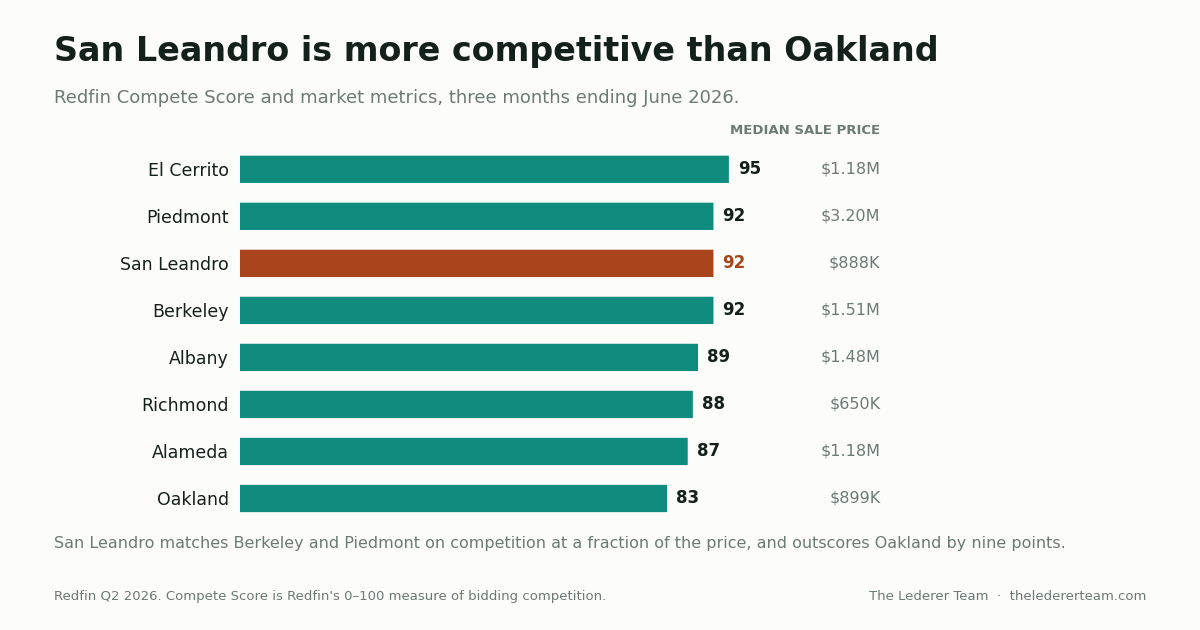
Compete Score is Redfin's measure of how hard it is to win a house, on a 0 to 100 scale. San Leandro's 92 puts it in the same tier as Berkeley and Piedmont, and above the two cities most people assume are the hardest markets in the region.
Market | Median sale | Median DOM | % sold above list | Homes sold | Compete score |
|---|---|---|---|---|---|
El Cerrito | $1,179,358 | 14 | 90.4% | 52 | 95 |
San Leandro | $888,017 | 15 | 69.5% | 127 | 92 |
Berkeley | $1,509,179 | 15 | 83.1% | 228 | 92 |
Piedmont | $3,198,260 | 13 | 91.3% | 46 | 92 |
Richmond | $649,646 | 17 | 64.0% | 207 | 88 |
Oakland | $898,511 | 20 | 68.5% | 805 | 83 |
All figures are Redfin, three months ending June 2026, same methodology across every row. San Leandro sells five days faster than Oakland at a similar median, on 127 sales, which is enough transactions to trust.
I am using percent of homes sold above list rather than a sale-to-list ratio deliberately. Redfin's East Bay sale-to-list numbers run high enough to be an artifact of how this region prices listings, not a real measure of bidding. Share above list holds up.
Why it competes: the financing line
The structural reason San Leandro draws crowds is that its price point sits under the conforming loan limit while most of the East Bay does not. The 2026 one-unit conforming limit for Alameda County is about $1.25 million, with FHA and VA matching. Confirm the exact figure with your lender before you rely on it.
At an $888,017 median, a San Leandro buyer with a normal down payment is financing conforming. In Berkeley, at a $1,509,179 median, many are not. Conforming borrowers are a much larger pool, and they qualify faster. That is a good part of why 69.5% of San Leandro homes clear asking.
Rates matter here more than they do at the top of the market. The 30-year fixed averaged 6.65% for the week ending August 20, 2026, with the 15-year at 5.95%, per the Freddie Mac Primary Mortgage Market Survey. Buyers at this price point are payment-driven, so rate moves show up in San Leandro traffic faster than in Piedmont's.
The supply picture reinforces it. East Bay inventory has been running 20% to 25% below last year as of June 2026, per RE/MAX Accord, and the East Bay single-family median was $1,235,000 in May 2026 against $1,150,000 a year earlier, up 7.4% on 1,465 closings. Broader context is in the East Bay market update.
The two neighborhoods that set the top
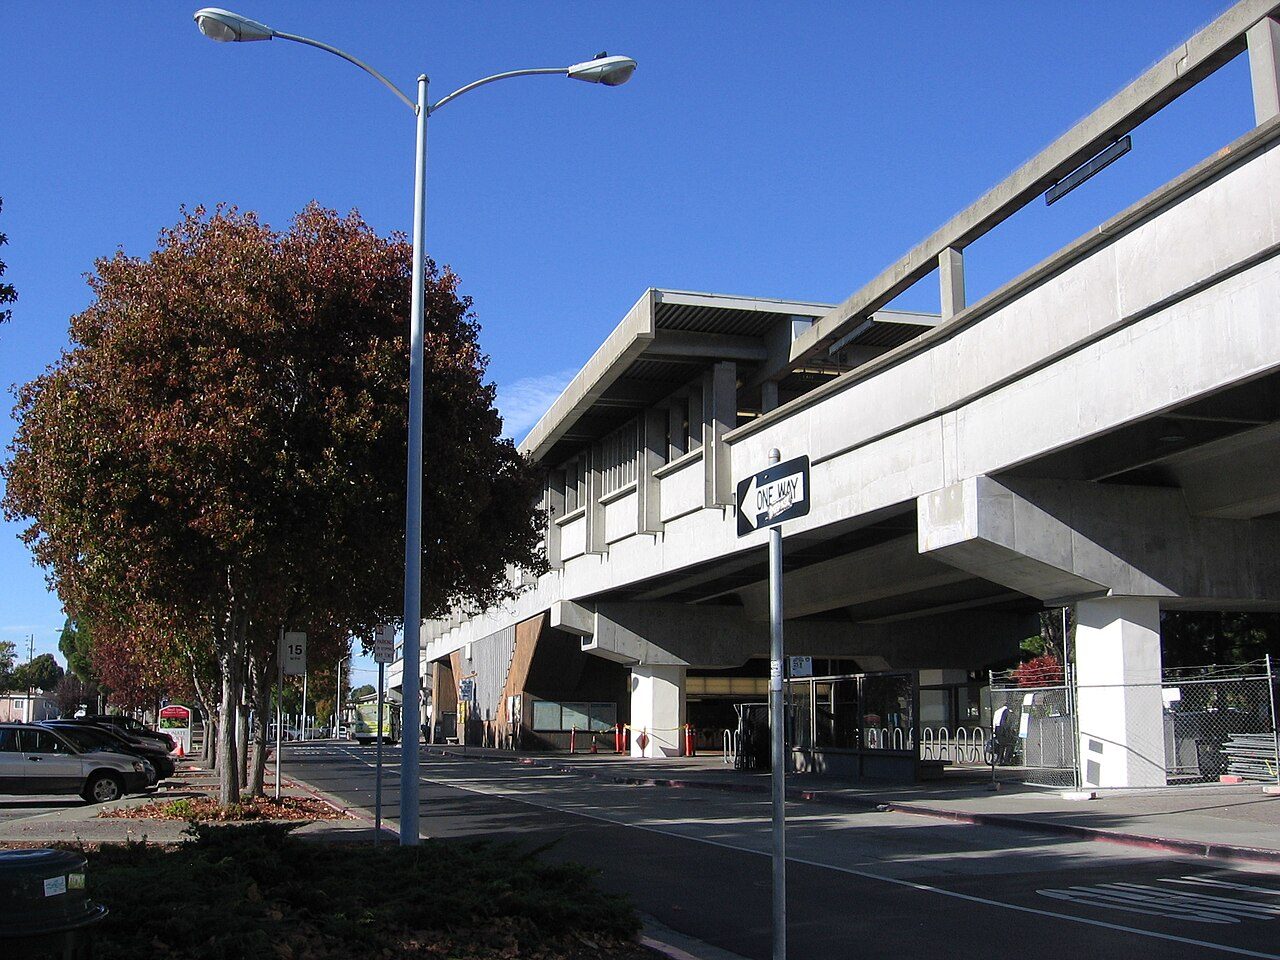
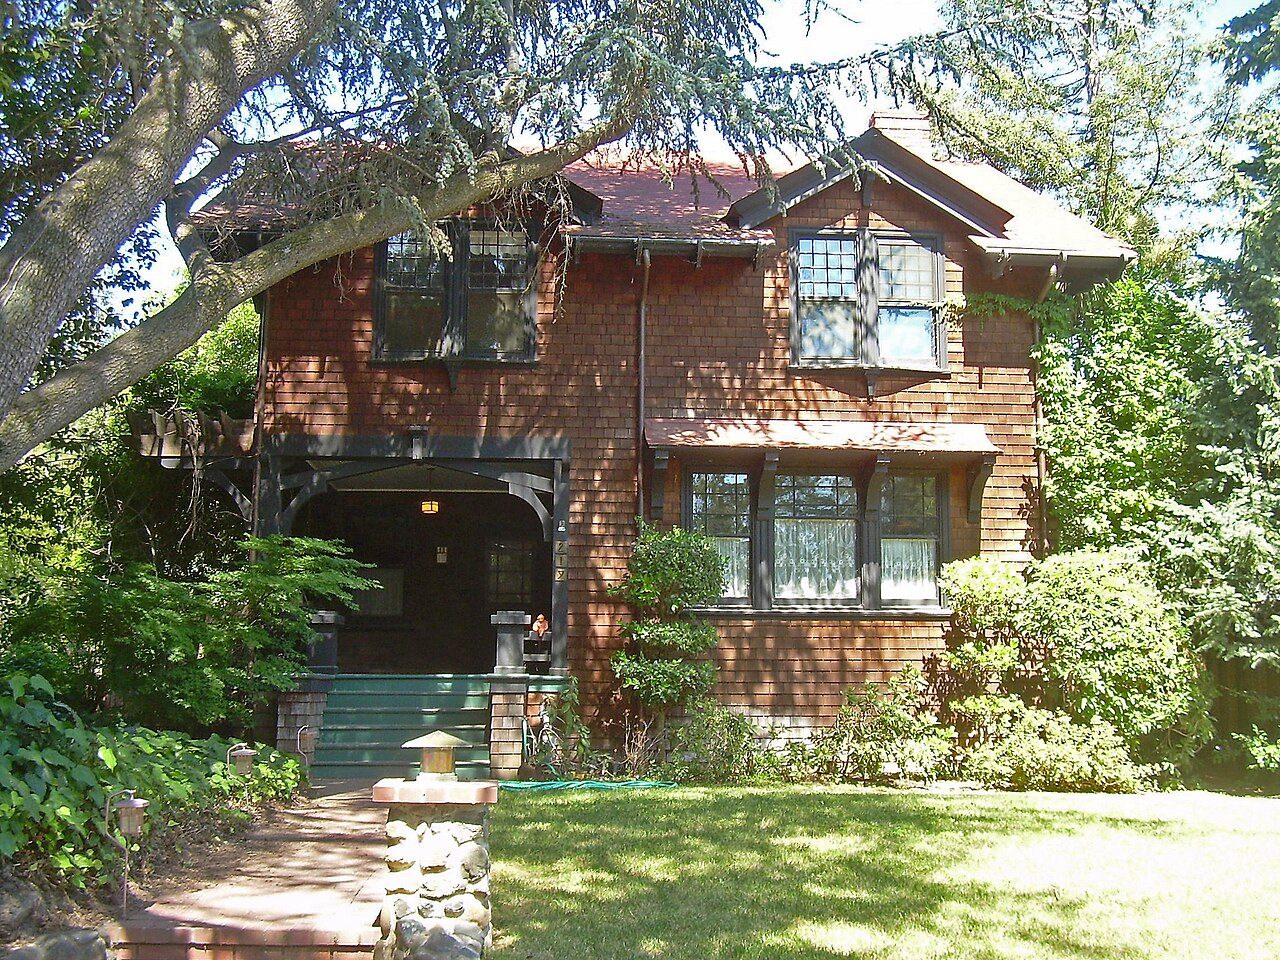
Estudillo Estates holds the highest price per square foot in the city: historic Craftsman and Spanish Revival housing within walking distance of San Leandro BART. Homes there trade roughly $900,000 to $1.1 million and above.
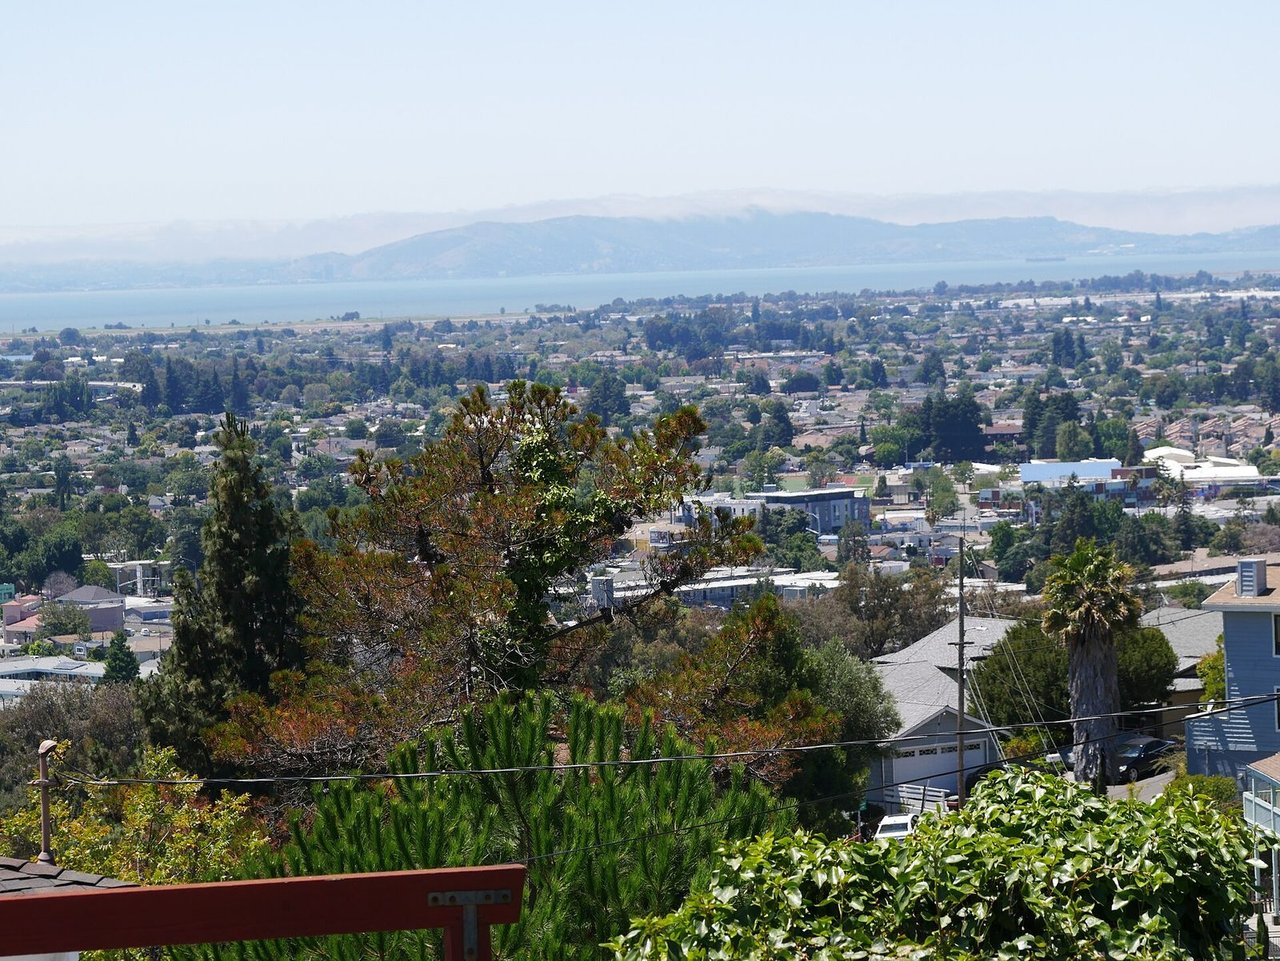
Bay-O-Vista is the hillside alternative, with bay views, larger lots and quick I-580 access, but it is not walkable to BART. It trades roughly $1.1 million to $1.3 million.
I am giving both as ranges on purpose. Neighborhood-level medians in San Leandro come off samples small enough that a single quarter can produce a swing that looks like a trend and is not. A range is the honest answer; a precise neighborhood median would not be.
The honest weakness: schools
This is where a seller should expect pushback, and where I would rather tell you now than have a buyer's agent tell you in week two.
San Leandro Unified ranked 1,026th of 1,543 California districts for 2024-25, down 134 slots year over year, across 8,834 students and 13 schools. The spread between individual schools in the district is wide, which means address-level research matters more here than in a city with uniform outcomes.
What that does to pricing is real but narrower than people assume. The buyers driving San Leandro's 69.5% above-list share are largely priced out of districts that rank higher, and they are trading school ranking for square footage, a BART commute and a conforming loan. Pretending the ranking says something else would not help anyone.
Transfer tax: lower here than almost anywhere nearby
San Leandro's city transfer tax is $11.00 per $1,000, plus Alameda County's documentary transfer tax of $0.55 per $500, which is $1.10 per $1,000.
City | City rate per $1,000 |
|---|---|
Hayward | $8.50 |
San Leandro | $11.00 |
Alameda | $12.00 |
Piedmont | $13.00 |
Oakland | $15.00 from $300K to $2M |
Berkeley | $15.00 up to $1.7M; $25.00 above |
Among Alameda County cities that charge one at all, only Hayward is lower. Who pays the transfer tax is a negotiated term, and the exact calculation should come from your title officer, not from a table. What I will not do is quote you a single percentage for total closing costs. Transfer tax and county recording fees are verifiable; title, escrow and commission vary and are negotiable, and any agent quoting one blended number is guessing.
If you are running the same exercise on a home in a different city, the method is the same one I use in how much is my Berkeley home worth.
Frequently asked questions
Is San Leandro a competitive housing market in 2026?
Yes. Redfin gives San Leandro a Compete Score of 92, above Oakland and San Francisco at 83. For the three months ending June 2026, 69.5% of San Leandro homes sold above list in a median of 15 days across 127 sales. That transaction count is large enough to be reliable rather than a small-sample artifact.
What is the median home price in San Leandro?
$888,017 for the three months ending June 2026, up 3.3% year over year, at $615 per square foot, per Redfin. That is just below Oakland's $898,511 for the same period, and roughly $620,000 below Berkeley. The figure covers the whole city; hillside and historic pockets trade well above it.
Why do San Leandro homes sell so fast?
Price point and financing. The 2026 conforming loan limit for Alameda County is about $1.25 million, so most San Leandro buyers finance conforming rather than jumbo, which widens the buyer pool substantially. Add East Bay inventory running 20% to 25% below last year as of June 2026, per RE/MAX Accord, and homes clear quickly. Confirm loan limits with your lender.
What are the schools like in San Leandro?
Mixed, and worth researching by address. San Leandro Unified ranked 1,026th of 1,543 California districts for 2024-25, down 134 slots year over year, across 8,834 students and 13 schools. The spread between individual schools is wide, so district-level ranking is a poor proxy for any particular attendance area. Verify specific schools with the district.
What transfer tax does a San Leandro seller pay?
San Leandro charges $11.00 per $1,000, and Alameda County adds $0.55 per $500, or $1.10 per $1,000. Among Alameda County cities that levy a transfer tax, only Hayward at $8.50 is lower; Oakland charges $15.00 in the common band. Who pays is negotiable between buyer and seller. Confirm the exact figure with your title officer.
Sources
- Redfin, city data, three months ending June 2026 — link
- Freddie Mac PMMS, week ending August 20, 2026 — link
- RE/MAX Accord, East Bay data, May and June 2026
- 2026 conforming loan limits, Alameda County (confirm with a lender)
- San Leandro Unified district ranking, 2024-25
- Alameda County Clerk-Recorder; City of San Leandro — link
Mark Lederer leads The Lederer Team at Red Oak Realty, with 25 years and more than 1,000 closed East Bay transactions. If you own in San Leandro and want to know what this level of competition means for your specific house and street, call 510-774-4231, email [email protected], or start with a valuation.