Short answer: The East Bay single-family median was $1,235,000 in May 2026, up 7.4% from $1,150,000 a year earlier, on 1,465 closed sales, per RE/MAX Accord. Inventory has been running 20% to 25% below last year. But the region is not moving as one market: Piedmont is up 15.3% while Alameda is down 2.1%.
The city-by-city numbers
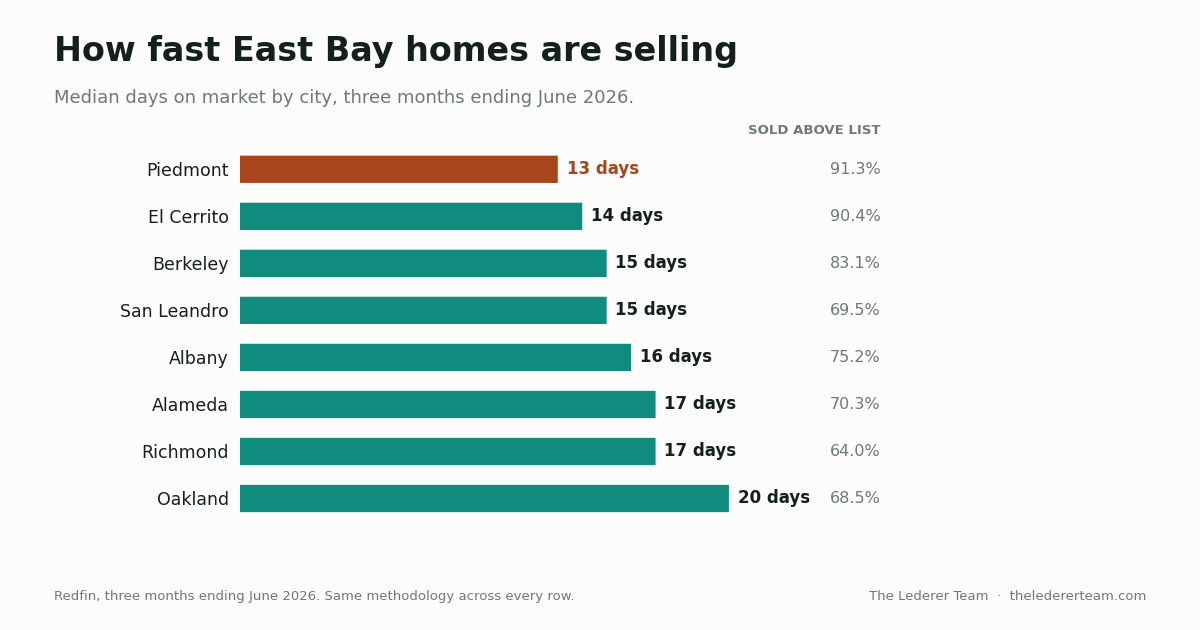
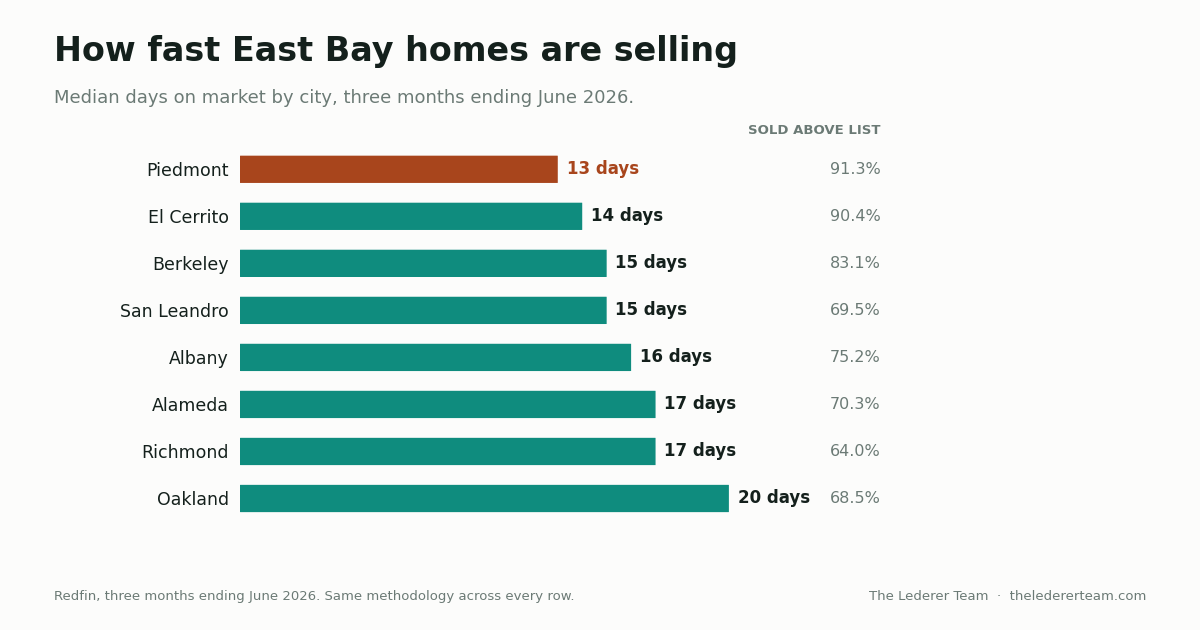
Everything in this table comes from Redfin for the three months ending June 2026, on the same methodology across every market. That consistency is why I lead with it. Mixing a Redfin figure for one city with a county association figure for another is how people end up comparing things that were never measured the same way.
Market | Median sale | YoY | Days on market | % sold above list | Homes sold | $/sq ft |
|---|---|---|---|---|---|---|
Piedmont | $3,198,260 | +15.3% | 13 | 91.3% | 46 | $1,260 |
Berkeley | $1,509,179 | +2.6% | 15 | 83.1% | 228 | $944 |
Albany | $1,484,192 | see note | 16 | 75.2% | 33 | $954 |
Alameda | $1,184,855 | −2.1% | 17 | 70.3% | 158 | $728 |
El Cerrito | $1,179,358 | see note | 14 | 90.4% | 52 | $672 |
Oakland | $898,511 | +5.7% | 20 | 68.5% | 805 | $537 |
San Leandro | $888,017 | +3.3% | 15 | 69.5% | 127 | $615 |
Richmond | $649,646 | +4.5% | 17 | 64.0% | 207 | $499 |
Contra Costa County | $842,623 | +2.1% | 18 | 49.9% | 992 | $503 |
Two columns deserve more attention than the median. Days on market sits in the teens almost everywhere, the real measure of absorption. And the share selling above list is above two thirds in every East Bay city listed, against 49.9% countywide in Contra Costa. That gap between the inner East Bay and the county at large is the market in one number.
The two year-over-year figures I will not print
You may have seen a year-over-year number for Albany or El Cerrito this summer. I left both blank on purpose, and I would rather explain why than publish a figure I do not believe.
Albany's median rose sharply year over year while its price per square foot fell 8.5%, on 33 sales. Both cannot describe the same market. That is a mix shift: a few larger houses closed in one period and not the other, pulling the median up while the value of a square foot fell. The honest statement is that Albany's median has run roughly $1.48 million to $1.59 million in 2026, on very thin volume.
El Cerrito has the same problem pointing the other way. Its reported median fell year over year while its price per square foot rose 3.4%. Again, mix. Honestly stated: El Cerrito's median has run roughly $1.18 million to $1.29 million in 2026, with price per square foot up slightly. That is a stable market, not a falling one, and its 90.4% share sold above list supports the stable reading.
Oakland deserves its own asterisk. Redfin shows the median up 5.7%. Zillow's home value index for Oakland showed a decline of 8.8% as of February 2026. Those two point in opposite directions because they measure different things, and any Oakland year-over-year figure quoted without that disclosure is doing you a disservice.
Rates, inventory, and why so little is for sale
The 30-year fixed averaged 6.65% in the week ending August 20, 2026, with the 15-year at 5.95%, per Freddie Mac. That number sets monthly payments, and it keeps listings off the market: owners holding a 3% loan do not trade it for a 6.65% loan.
The result is East Bay inventory running 20% to 25% below last year as of June 2026, per RE/MAX Accord. Thin supply plus intact demand is why days on market stay in the teens even where prices are flat.

County medians, measured a different way
The California Association of Realtors publishes county medians on a different methodology than Redfin, so these belong in their own table, never blended with the one above.
Area | Median, July 2026 | Year over year | Month over month |
|---|---|---|---|
Alameda County | $1,275,000 | +2.0% | −3.8% |
Contra Costa County | $875,000 | +1.4% | −4.9% |
California | $887,680 | +0.3% | — |
Both counties are up slightly on the year and down on the month. Read the monthly move as seasonality and mix, not a turn. One month is not a trend in either direction.
Where the market is actually splitting
The most useful framing comes from Redfin's data on the Bay Area price spread: homes in the $3.1 million to $7.6 million band are up 13.4% since November 2022, while homes in the $535,000 to $615,000 band are down 3.8% over the same stretch. Redfin senior economist Yingqi Xu called it "another sign of the K-shaped economy taking shape in the Bay Area." The table above shows the same shape locally. Piedmont at +15.3% and Alameda at −2.1% are the same region in the same quarter.
Alameda is the one market I would flag for owners. It is the only major East Bay city showing a declining median, declining price per square foot, lengthening days on market and a falling share selling above list at once. Four indicators agreeing is different from one median wobbling.
At the other end, San Leandro is the market people keep underrating, which I take apart in San Leandro is quietly one of the East Bay's most competitive markets. And if the above-list percentages look strange to you, they reflect a regional pricing convention I explain in why East Bay homes sell over asking.
A regional median will not translate into a number for your own house. Berkeley alone spans a wide range depending on the block, which is the subject of how much is my Berkeley home worth. For the specific figure, we run the comps by hand and show our work: request a valuation at theledererteam.com/home-valuation.
Frequently asked questions
What is the median home price in the East Bay in 2026?
The East Bay single-family median was $1,235,000 in May 2026, up 7.4% from $1,150,000 a year earlier, on 1,465 closed sales, per RE/MAX Accord. City medians vary widely around that figure. For the three months ending June 2026, Redfin put Piedmont at $3,198,260, Berkeley at $1,509,179, Oakland at $898,511 and Richmond at $649,646.
Are East Bay home prices going up or down right now?
Both, depending on the city. For the three months ending June 2026, Redfin shows Piedmont up 15.3%, Oakland up 5.7%, Richmond up 4.5% and San Leandro up 3.3%, while Alameda is down 2.1%. Regionally, Redfin data shows Bay Area homes priced $3.1 million to $7.6 million up 13.4% since November 2022 while homes from $535,000 to $615,000 are down 3.8%.
Why is East Bay inventory so low in 2026?
Inventory has been running 20% to 25% below last year as of June 2026, per RE/MAX Accord. The main reason is rates. The 30-year fixed averaged 6.65% in the week ending August 20, 2026, per Freddie Mac, and owners holding much cheaper pandemic-era loans are reluctant to give them up. Fewer listings is also why days on market sit in the teens across most of the region.
Why do sources disagree about Oakland home prices?
Because they measure different things. Redfin reported Oakland's median up 5.7% to $898,511 for the three months ending June 2026, while Zillow's home value index showed Oakland down 8.8% as of February 2026. A sale median reflects only what actually closed, so it moves with the mix of homes sold. An index estimates value across all homes. Any Oakland figure quoted without naming its source and period is incomplete.
Which East Bay city is the most competitive right now?
By share of homes selling above list for the three months ending June 2026, Piedmont leads at 91.3%, followed by El Cerrito at 90.4% and Berkeley at 83.1%. On Redfin's Compete Score, El Cerrito scores 95 and San Leandro 92, both higher than Oakland at 83. Oakland's 83 matches San Francisco's, which surprises most people who assume Oakland is the softer market.
Sources
- Redfin city market data, three months ending June 2026 — redfin.com
- RE/MAX Accord East Bay market reports, May and June 2026
- California Association of Realtors county medians, July 2026 — car.org
- Freddie Mac Primary Mortgage Market Survey, week ending August 20, 2026 — freddiemac.com
- Redfin analysis of Bay Area price tiers, Nov 2022 to May 2026, via Fortune
Mark Lederer leads The Lederer Team at Red Oak Realty, with 25 years and more than 1,000 East Bay closings behind him. To learn what these numbers mean for one address rather than a region, call 510-774-4231 or email [email protected].