AI companies now lease more than 2.8 million square feet of San Francisco office space. A two-bedroom apartment in San Francisco rents for a median $6,020 a month, up 25.9% from last July. The same apartment in Oakland rents for $2,640. That $3,380 monthly difference is the widest gap ever recorded between the two cities, and it is doing more to move East Bay demand than anything happening inside the East Bay itself. East Bay single-family medians were up 7.4% year over year in May 2026. Oakland's rental vacancy fell from 7.2% to 4.1% in twelve months. BART ridership hit a post-pandemic high in March 2026. The pressure is real. It is also arriving unevenly, and plenty of East Bay homes are getting none of it.
The short version
- AI is an office story before it is a housing story. OpenAI leases roughly 1.2 million square feet in San Francisco and Anthropic about 995,000. Those seats hold people who have to show up.
- San Francisco cannot absorb the demand. Apartment vacancy is 2.2%, median two-bedroom rent is $6,020, and the metro median home price reached $1.7 million in March 2026, up 14.4% year over year.
- The overflow lands east. Oakland's vacancy rate has nearly halved in a year, and Oakland's median rent has climbed 19% since it bottomed out in May 2024.
- The East Bay is splitting. Redfin data shows Bay Area luxury homes up 13.4% since ChatGPT launched while entry-level homes are down 3.8%. That split is showing up street by street in Alameda and Contra Costa counties.
- The timing is slow. Local developers put the lag at 18 months or more for rentals and longer for commercial space. This is a positioning window.
What is actually happening in San Francisco
Most coverage of AI and Bay Area real estate stops at the headline. Engineers got rich, prices went up. The mechanism is more specific than that, and the specifics matter if you own a home in Berkeley or you're trying to buy one in Alameda.
Three things happened at once.
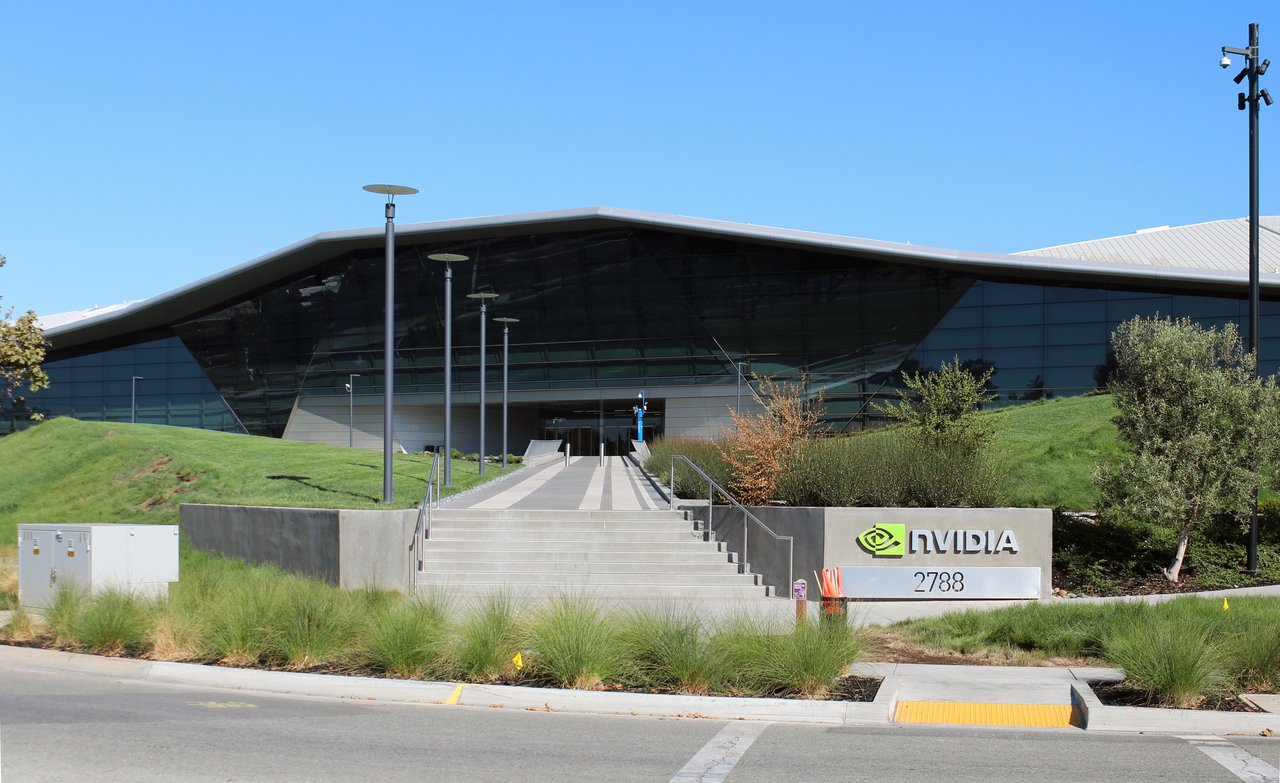
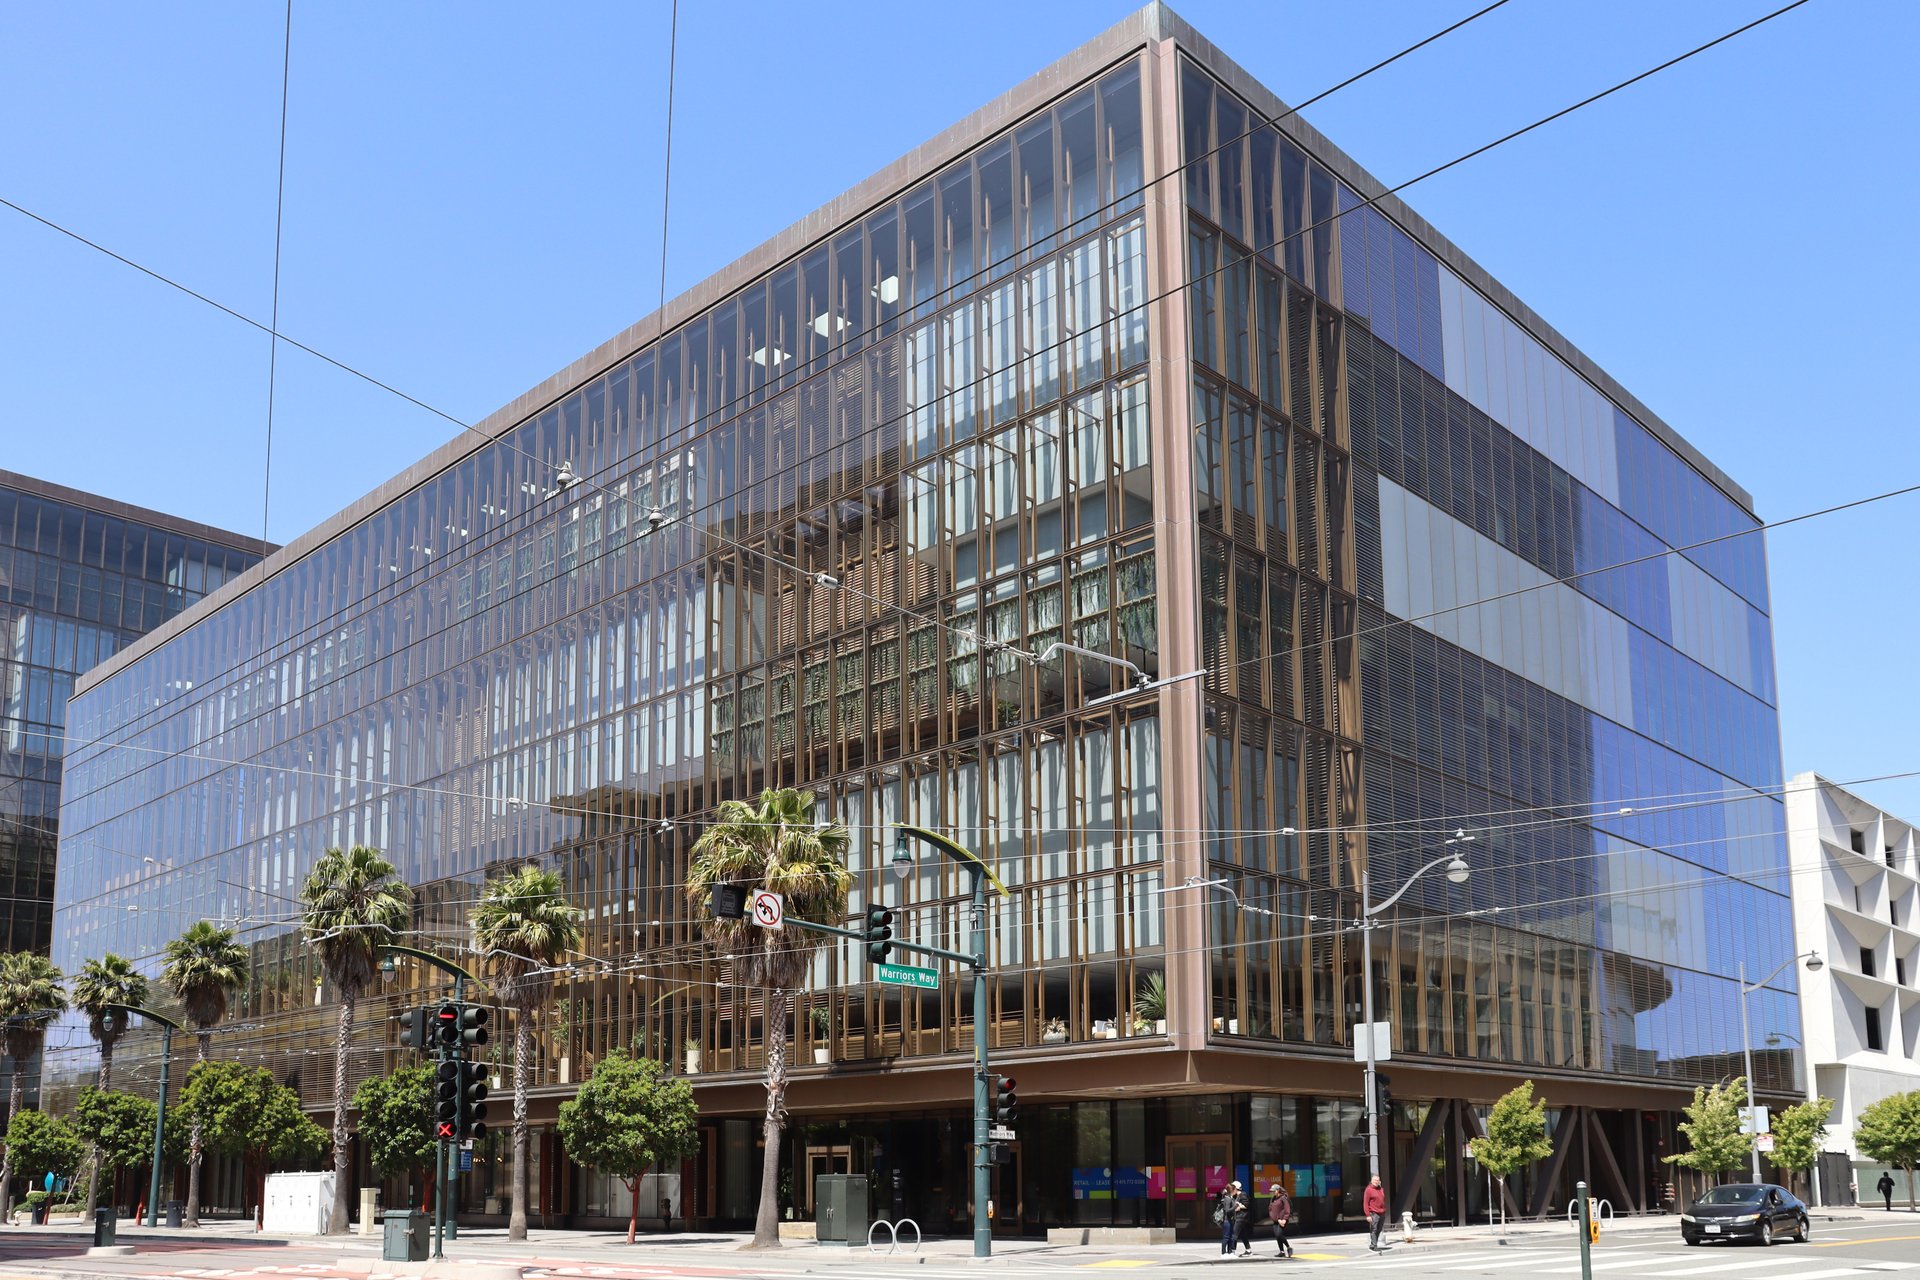
First, the AI companies signed leases. As of April 2026 they held more than 2.8 million square feet in San Francisco, concentrated in Mission Bay and SoMa. OpenAI leads at roughly 1.2 million square feet. Anthropic is at about 995,000, Sierra AI at 300,000, Scale AI at 180,000, and Harvey at 150,000. These are ten-year commitments. A company that plans to stay remote does not sign one.
Second, those seats came with return-to-office expectations. The frontier labs are among the most in-person employers in tech. That takes a workforce which could have lived in Sacramento or Boise and puts it back within commuting distance of downtown San Francisco.
Third, San Francisco's housing supply did not move. Apartment vacancy sits at 2.2%. Median two-bedroom rent crossed $6,000 for the first time in Zumper's decade-plus of records, landing at $6,020 in July 2026, the highest in the country and ahead of New York. One-bedrooms average $4,180, up 22.9% from a year ago.
When pay rises faster than housing supply, the people who get squeezed start looking at the map for the next best option with a reasonable commute. On that map, the East Bay is the obvious answer.
Why the money lands in the East Bay
The East Bay has always been San Francisco's pressure valve. What's different in 2026 is the size of the price gap and the direction of the commute.
The rent gap is the widest ever recorded
Median rent, July 2026 | San Francisco | Oakland | Gap |
|---|---|---|---|
One-bedroom | $4,180 | $2,090 | $2,090 |
Two-bedroom | $6,020 | $2,640 | $3,380 |
Year-over-year change (all units) | +23% | +13% | |
Apartment vacancy rate | 2.2% | 4.1% |
Source: Zumper and Apartment List data, July 2026, as reported by The San Francisco Standard and CBS News Bay Area.
A two-bedroom in San Francisco costs 128% more than the same unit in Oakland. That's a $3,380 monthly difference, the widest on record. The narrowest gap ever recorded was $940, back in December 2020, when the consensus was that San Francisco had permanently emptied out.
A gap that wide doesn't hold. Renters close it first. Buyers follow.
The commute got usable again
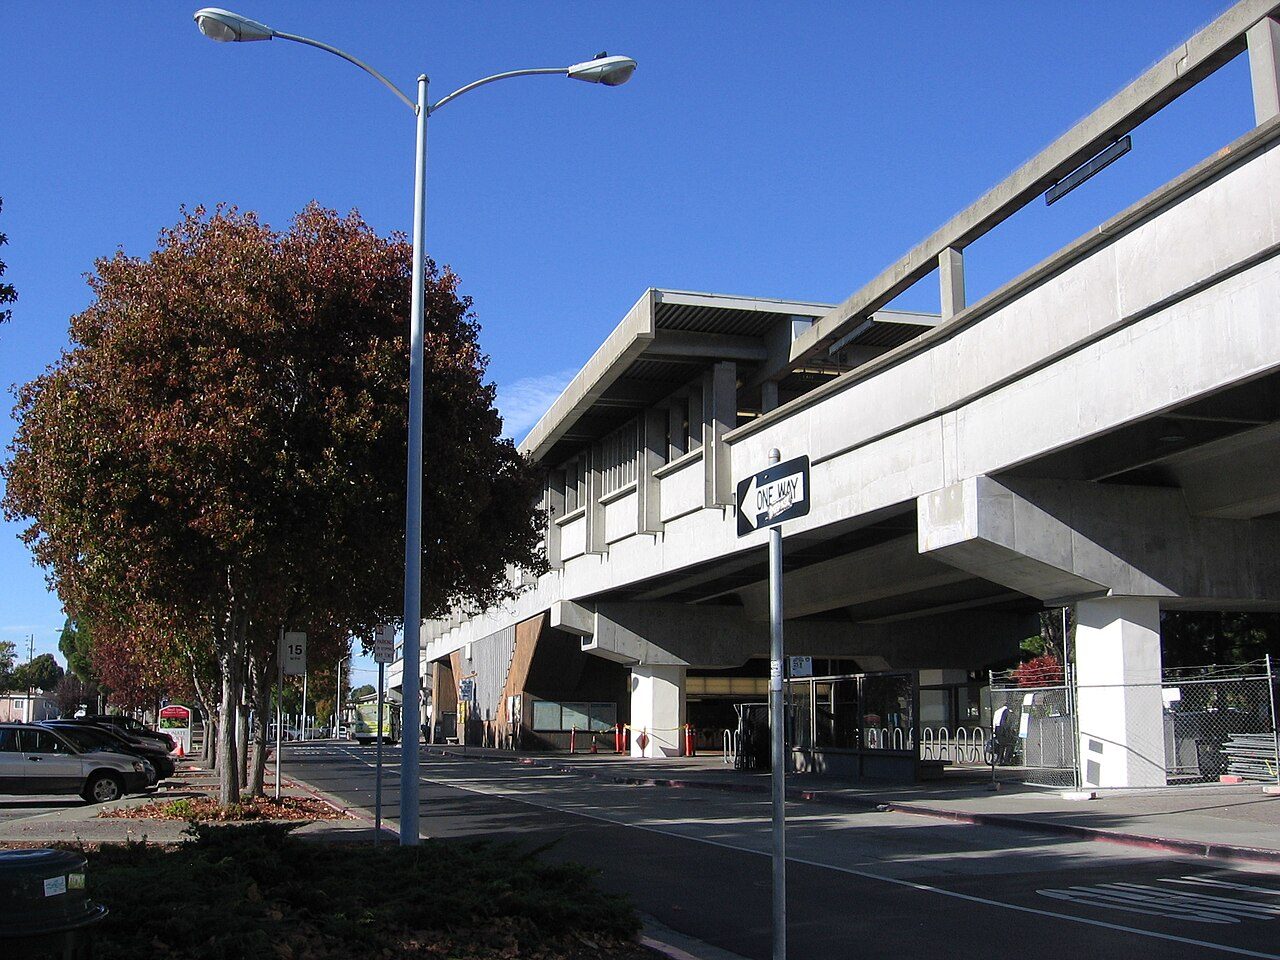
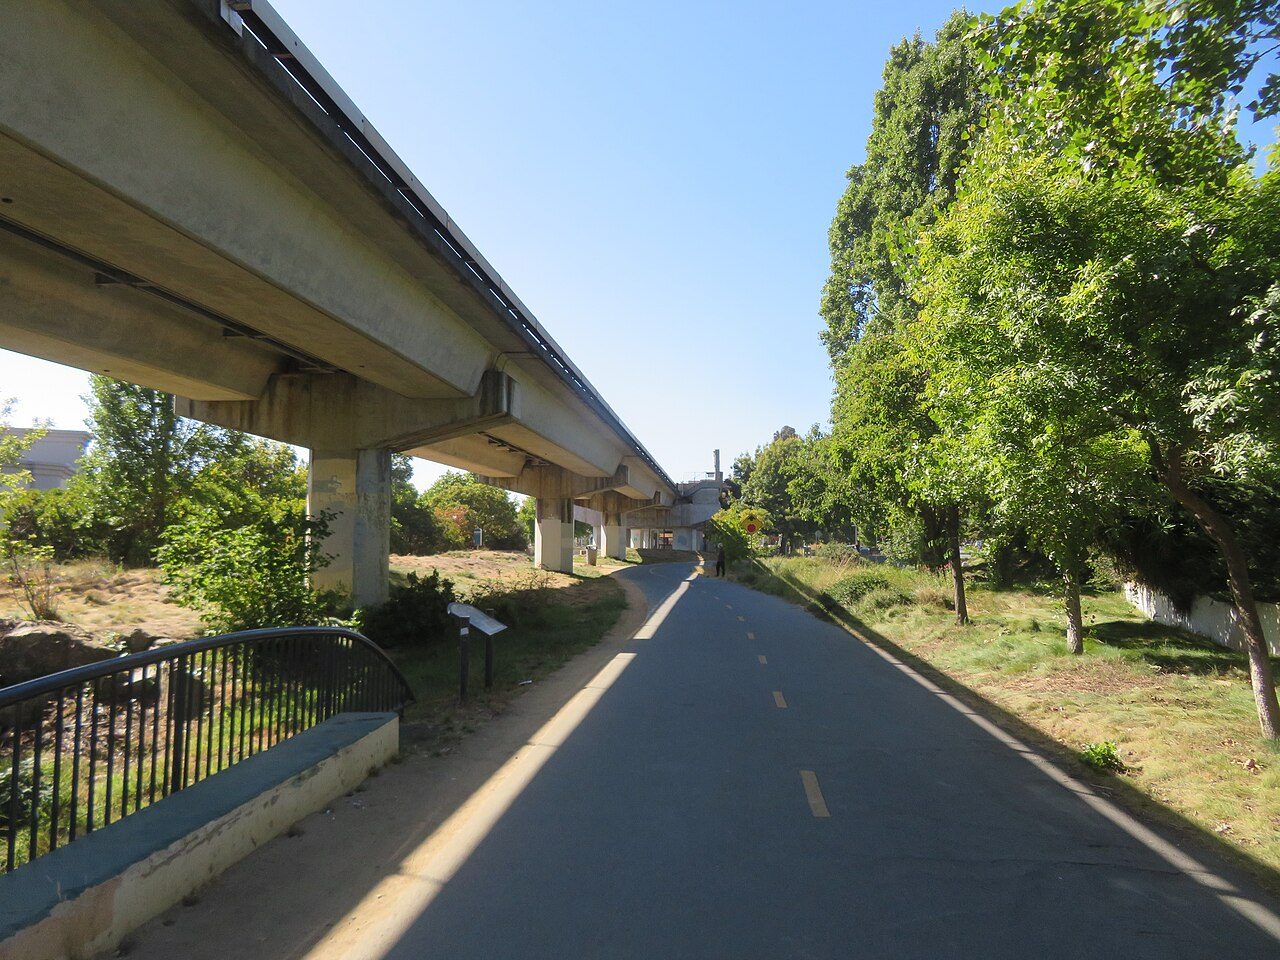
BART recorded 5,403,140 exits in March 2026, its highest monthly total since the pandemic and 20% above March 2025. Average weekday ridership crossed 200,000 for the first time since 2020.
This part gets underrated. Return-to-office only pushes buyers east if getting to the office is tolerable. Rockridge to Montgomery Street runs about 20 minutes. El Cerrito Plaza to Embarcadero is roughly 30. Walnut Creek to downtown San Francisco is around 40. Those times compete with a crosstown Muni ride at half the housing cost.
The buyer is different this time
The East Bay migrations I worked through in 2014 and 2018 were driven by people who couldn't afford San Francisco. The 2026 version includes a meaningful number of people who can afford San Francisco and are picking the East Bay anyway. More square footage. A yard. Better public schools in specific districts. A house instead of a condo. In practice that buyer shows up with a larger down payment and less price sensitivity than the historical East Bay norm, and they compete hardest for renovated homes, view properties, and anything architecturally distinctive.
Where the data already shows it
Here's where I want to be careful, because this is the point where most agent blog posts overstate the case. The AI effect is visible in East Bay data. It is not uniform, and in some submarkets it isn't visible at all.
Market | Median sale price | YoY change | Days on market | Sold above list |
|---|---|---|---|---|
East Bay overall (SFH) | $1,235,000 | +7.4% | ||
Berkeley | ~$1,509,000 | +2.6% | 15 | 83.1% |
Contra Costa County | $842,623 | +2.1% | 18 | 49.9% |
Oakland | $740,000 | +0.4% | 18 | 55.9% |
Lafayette | $2,060,000 | +20% |
Source: Bay East MLS data compiled by The Lederer Team. Berkeley and Contra Costa County figures cover the three months ending June 2026; Oakland covers February 2026. Time periods and property-type mixes differ by market, so treat these as directional.
Read that table and the pattern that matters shows up fast. The higher the price band, the stronger the appreciation. Lafayette is up 20% on a $2.06 million median. Oakland is up 0.4% on a $740,000 median.
The K-shaped market
The pattern runs across the whole region. Redfin's analysis found that since ChatGPT launched in November 2022, Bay Area homes in the $3.1 to $7.6 million range are up 13.4%, while homes in the $535,000 to $615,000 range are down 3.8%. In the 2020 to 2022 cycle, every price segment rose roughly 20% together.
"It's another sign of the K-shaped economy taking shape in the Bay Area," Redfin senior economist Yingqi Xu said.
On the ground in Alameda and Contra Costa counties, that means AI wealth is landing on a specific profile of house: move-in ready, well located, architecturally interesting, walkable or close to BART. Homes with deferred maintenance, awkward floor plans, or a busy street out front are in a different market, and in several submarkets that market is softening.
Sales volume backs this up. Between early 2025 and early 2026, sales activity jumped 67% in Lafayette, 62% in San Ramon, 42% in Walnut Creek, 40% in Moraga, and 30% in Orinda, while West Contra Costa eased. Alameda was up about 10% year over year on price and Berkeley about 9%. Oakland showed a 7% decline over the same window.
Two houses two miles apart are having completely different years. That's the 2026 East Bay market.
What this means if you are selling
The instinct is to wait. If AI money is coming, why not sell into a stronger 2027? A few reasons to think harder about that.
Inventory is your leverage right now, and it's scarce. Oakland is running at 0.92 months of supply, and new listings there were down 35% year over year in January 2026. Inventory across many East Bay markets is running 20% to 25% below last year. List into a market with almost nothing to compare against and you capture the full premium of scarcity. Wait until every neighbor has the same idea and you split it.
Your price band determines your strategy, and the regional median tells you nothing about it. If you own a renovated home near BART in the upper half of your market's price range, the AI-adjacent buyer is your buyer, and preparation and presentation are worth real money. Berkeley homes are closing in 15 days with 83% selling above list. If your home sits in the entry-level band with deferred maintenance, waiting for the AI wave to reach you could mean waiting a very long time. That equity is probably better redeployed than parked.
The lag cuts both ways. Danny Haber, cofounder and CEO of the Oakland developer oWow, put it at "at least 18 months before meaningful change in Oakland's rental market" from San Francisco demand, and three years minimum before commercial pressure brings office tenants back. Rob Warnock at Apartment List describes Oakland as still renter friendly but moving in San Francisco's direction every month. Nobody credible is calling for a 2026 spike. This is a two to three year repricing, which means you have time to prepare a listing properly instead of rushing one.
If you want a specific read on where your home falls in that split, request a valuation. We look at your actual price band and condition profile, and the county median never enters the conversation.
What this means if you are buying
You're not late, though you are on the clock in specific submarkets. The homes drawing AI-adjacent competition today are turnkey properties inside a 30-minute BART commute in the upper price bands. If that's your target, expect five or more offers and real overbids. Line up your financing, inspections, and disclosure review before you find the house.
The best value in the East Bay right now sits in the other half of the K. Entry-level and deferred-maintenance properties see far less competition than they did in 2021. If you can underwrite a renovation, you're buying into a segment that's flat to down while the segment above you appreciates. That's where the margin is.
And a warning. The AI migration is a directional tailwind for the region. It guarantees nothing about any single property. A house that's wrong for you at a good price is still wrong for you.
If you want to see the specific streets and price bands where this is playing out, start with a buyer consultation.
What could break this thesis
Most posts on this topic stop at the bullish case. Here's the other side, because you should weigh it.
- AI capital is concentrated and reflexive. A meaningful correction in AI valuations would hit the paper wealth funding these purchases before it hits anything else. Most of this money is equity.
- San Francisco has been here before. Even during this boom, Bay Area headquartered tech companies announced roughly 40,000 layoffs in 2025, and San Francisco's information sector still shed jobs on net that year. Hiring is concentrated in a narrow slice of AI firms while the rest of tech is flat. Booms in this region historically overshoot in both directions.
- Supply can respond. California's housing legislation and Oakland's development pipeline could add units into exactly this demand.
- Rates matter more than narratives. At mid-6% mortgage rates, affordability is still the binding constraint for most East Bay buyers.
The reasonable position: treat the AI boom as a real, measurable source of East Bay demand on a two to three year timeline, and don't let it talk you into a decision you wouldn't otherwise make.
Frequently asked questions
Is the AI boom raising East Bay home prices?
Partially, and unevenly. East Bay single-family medians rose 7.4% year over year as of May 2026, and higher-priced submarkets like Lafayette are up around 20%. Entry-level Bay Area homes are down 3.8% since late 2022 according to Redfin, and Oakland's median was essentially flat at 0.4% in early 2026. AI demand is concentrating in specific price bands and property types instead of lifting the whole market.
Which East Bay cities are benefiting most from the AI boom?
The clearest gains show up in higher-priced, commute-friendly markets. Lafayette has a $2.06 million median and is up about 20%. Moraga, Orinda, Walnut Creek, and San Ramon all posted sales activity jumps between 30% and 67% year over year. Berkeley and Alameda are seeing steady price gains with fast sales, and Berkeley homes close in about 15 days with 83% selling above list. Oakland and West Contra Costa lag on price, though Oakland's rental market is tightening quickly.
How much cheaper is Oakland than San Francisco in 2026?
A two-bedroom apartment rents for a median $2,640 in Oakland versus $6,020 in San Francisco as of July 2026. That's a $3,380 monthly difference and the widest gap on record. San Francisco costs 128% more for the equivalent unit.
When will the AI boom actually hit East Bay prices?
Local developers and analysts put the lag at roughly 18 months for the rental market and up to three years for commercial demand. Oakland's vacancy rate has already fallen from 7.2% to 4.1% in a year, and that's the leading indicator. Rents follow tightening vacancy, and sale prices follow rents.
Should I sell my East Bay home now or wait for the AI wave?
It depends which side of the split your home sits on. Inventory is running 20% to 25% below last year across many East Bay markets and Oakland is under one month of supply, so scarcity is working in sellers' favor right now. Turnkey homes near BART in upper price bands are capturing AI-adjacent demand today. Entry-level homes with deferred maintenance may wait years for that demand to arrive, and holding for it carries real opportunity cost.
Are AI workers buying in the East Bay, or just renting?
Both, in sequence. The rental market moves first, and Oakland's vacancy halving in twelve months is the visible signal. Purchases follow as renters settle in and equity compensation vests. The East Bay saw the same pattern after the 2014 and 2018 San Francisco cycles, on a smaller scale.
Sources
- Zumper National Rent Report, July 2026, via CBS News Bay Area
- The San Francisco Standard, "Two-bedroom apartments hit $6K for the first time in SF," August 6, 2026
- The San Francisco Standard, "Ranking SF's biggest AI companies by office size," April 7, 2026
- Fortune, Redfin analysis of Bay Area price segments, May 7, 2026
- BART, "March breaks multiple records for post-pandemic ridership," April 13, 2026
- Bay East MLS, compiled by The Lederer Team
Mark Lederer leads The Lederer Team at Red Oak Realty, with 25+ years and more than 1,000 closed transactions across El Cerrito, Berkeley, Oakland, Alameda and the greater East Bay. Questions about how this applies to your specific block? Call 510-774-4231 or email [email protected].