Commis
★★Oakland
James Syhabout's refined Californian tasting menu on Piedmont Avenue — the East Bay's only two-star room.
Fourteen cities, twenty-two BART stations, and the deepest food scene in the Bay Area outside San Francisco — from Berkeley brown shingles to Tri-Valley new construction.
14
Cities
1.64M
Residents
22
BART Stations
16
Bib Gourmand
What's a Bib Gourmand? Michelin's award for exceptional food at moderate prices — the inspectors' answer to where they actually eat. Alameda County holds sixteen of them, more than any Bay Area county except San Francisco, plus two starred restaurants in Oakland. It is the most interesting place to eat in the region for under fifty dollars.
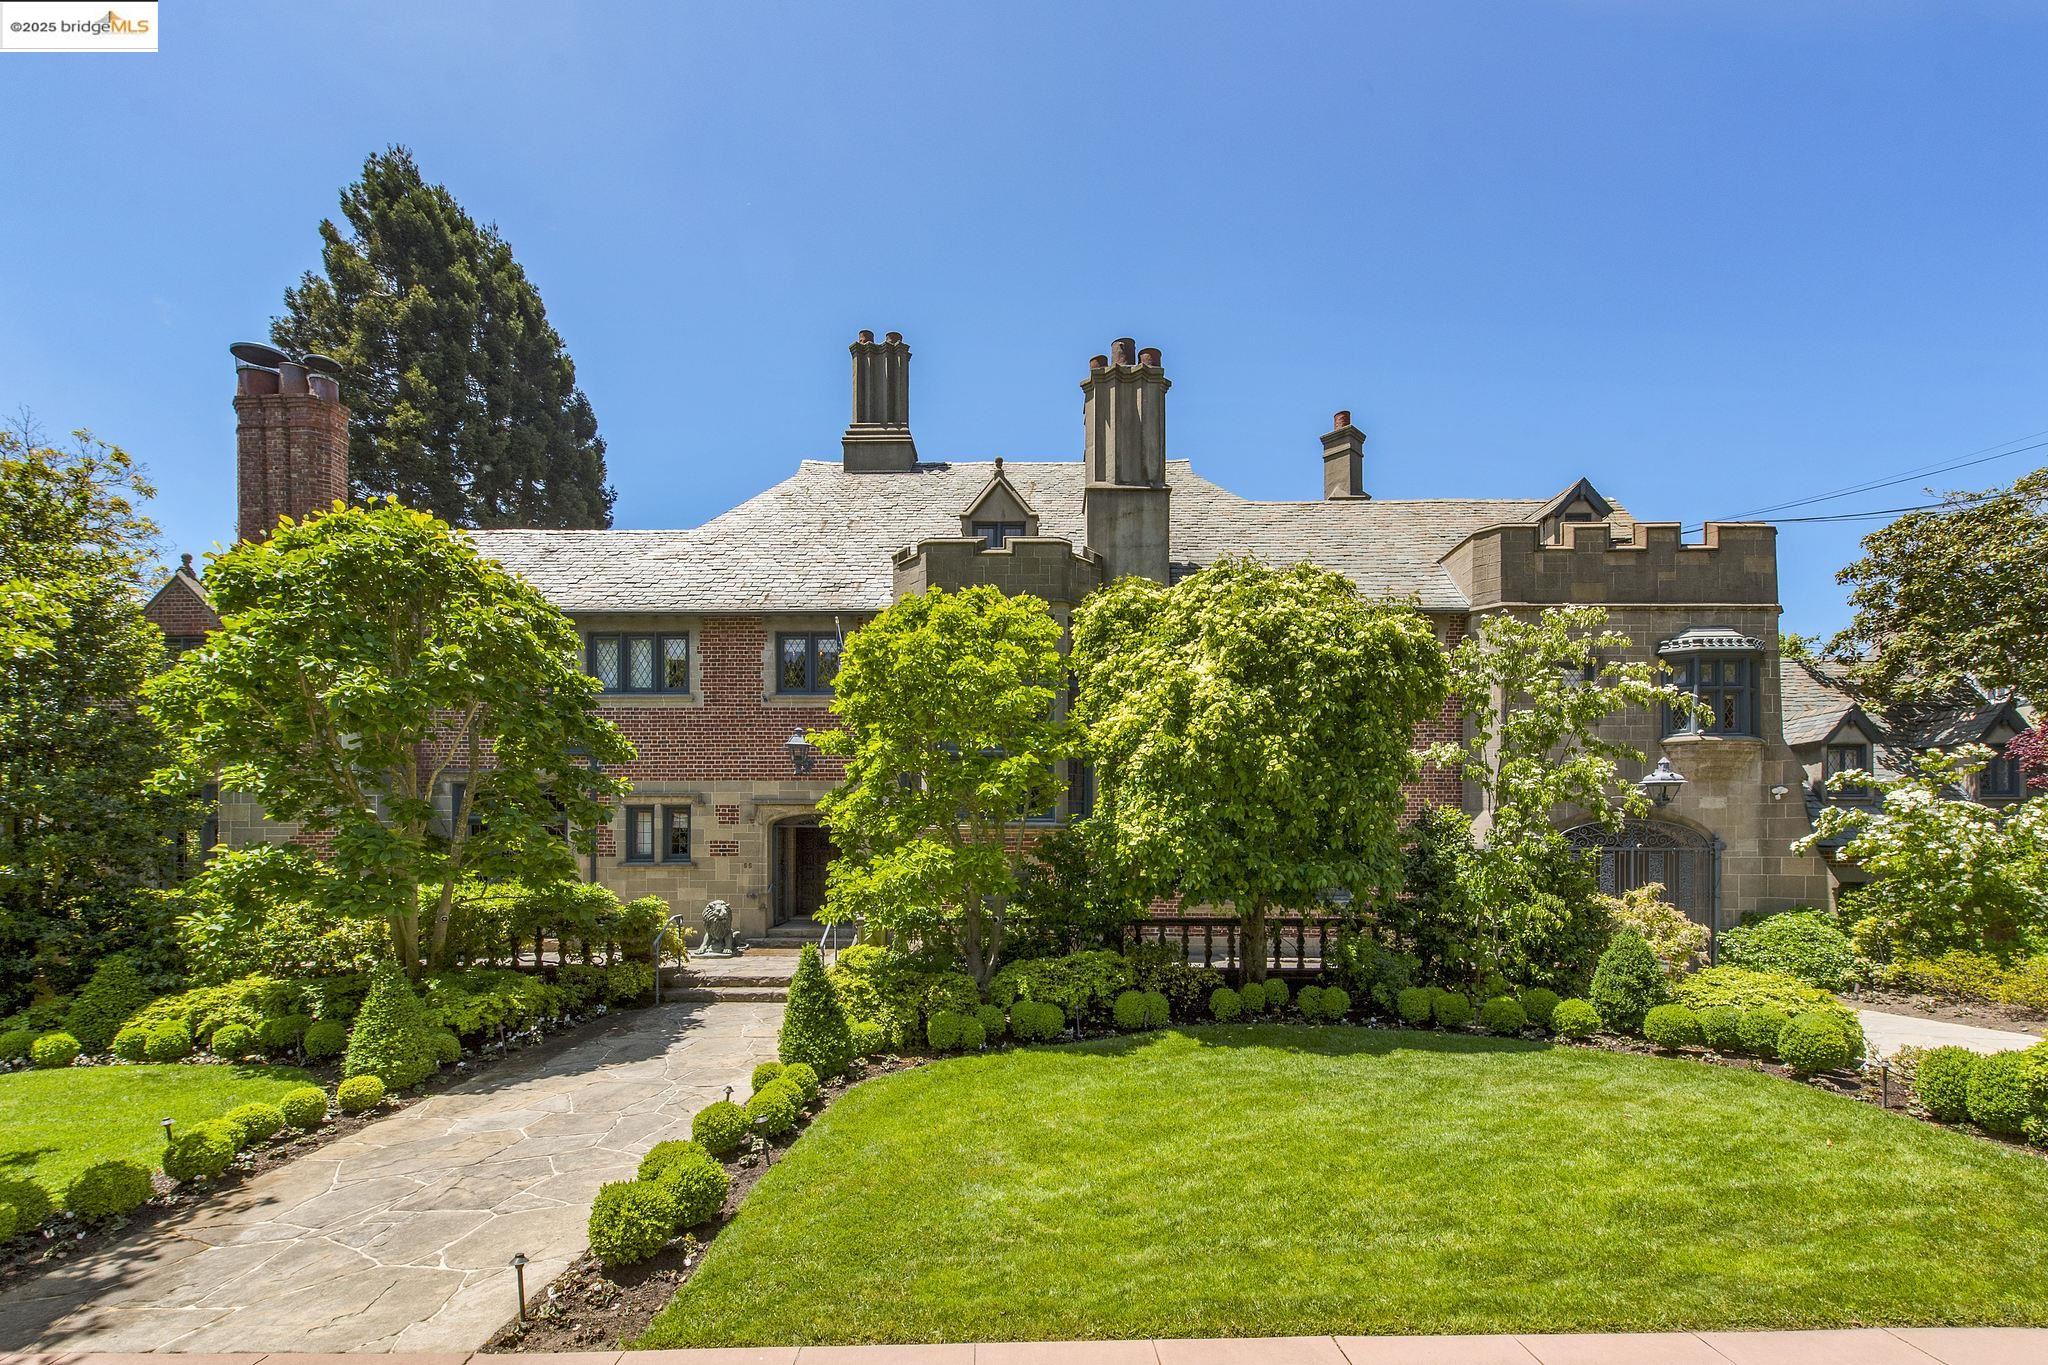
Alameda County runs along the east shore of San Francisco Bay and then climbs east over the hills into the Livermore Valley. Oakland and Berkeley anchor the north, the flatlands and the hills behind them holding some of the most varied housing stock in California. South through San Leandro, Hayward, Union City, and Fremont the county industrializes and then suburbanizes. Over the ridge, Dublin, Pleasanton, and Livermore are a different world again — newer, warmer, and built around the 580.
It is the seventh most populous county in California and the operational heart of the East Bay: BART is headquartered here, the Port of Oakland is one of the ten busiest container ports in the country, and the University of California's flagship campus sits in the middle of it.
All fourteen
≈ 440,800
North. The widest range of housing in the county — Craftsman bungalows in the flats, contemporaries in the hills, lofts downtown — served by nine BART stations. The intra-city price spread is enormous, and neighborhood knowledge matters more here than anywhere.
≈ 121,900
North. Brown shingle and Craftsman in the hills, bungalows in the flats, two BART stations, and the university in the middle. Upper tier, with the hills commanding a steep premium over the flats.
≈ 226,400
South. The county's second-largest city. Fifties through seventies tracts plus newer infill, two BART stations, and a Silicon Valley commute that drives upper-tier pricing.
≈ 157,100
Central. Mid-century tracts and hillside homes with three BART stations and a genuinely central position. Below the county median — the primary value play.
≈ 85,400
Central. Compact post-war bungalows and ranches, two BART stations, tight freeway access. Below the county median and one of the most popular first-purchase markets in the East Bay.
≈ 83,500
Tri-Valley. Suburban tracts around a restored historic downtown, with the Livermore Valley wine region at the edge of town. End-of-line BART and the county's longest commute, at mid-tier pricing.
≈ 76,900
North. An island city with dense Victorian, Edwardian, and bungalow stock plus new construction at Alameda Point. Ferry and tube instead of BART, which keeps it quieter than its price suggests.
≈ 74,600
Tri-Valley. Well-kept suburban tracts, a walkable Main Street, and schools that drive demand. Two BART stations and the top of Tri-Valley pricing.
≈ 71,600
Tri-Valley. The newest large-scale stock in the county — 2000s subdivisions and transit-oriented condos beside two BART stations. Upper-mid, and the best square footage per dollar in new construction.
≈ 65,300
South. Seventies and eighties tracts around a BART station getting a major intermodal upgrade. Mid-tier, and priced under Fremont next door.
≈ 47,900
South. Flat sixties and seventies tracts plus new bayfront development. No BART of its own, but priced meaningfully below Fremont — which is the entire draw.
≈ 19,200
North. Barely two square miles, entirely walkable, small pre-war bungalows on compact lots. Schools drive the demand; high price per square foot, but the small footprints cap the entry price.
≈ 13,300
North. Condos and lofts on former industrial land, almost no single-family stock. No BART station, but a central freeway position and the lowest entry price in the north county.
≈ 10,600
North. An enclave entirely surrounded by Oakland, with large period homes and its own school district. The highest-priced city in the county, and the most supply-constrained.
County-governed
Unincorporated. Castro Valley is larger than four of the county's cities, with its own BART station and school district. San Lorenzo offers unusually uniform post-war tract stock at a lower entry point.
County-governed
Unincorporated. Ashland, Cherryland, and Fairview sit at the county's lower price tier beside Hayward and San Leandro. Sunol stays rural, at the mouth of the Livermore Valley.
Population figures are U.S. Census Bureau estimates for July 2025. California Department of Finance figures differ in some cities and are the number more often cited locally.
Twenty-two BART stations sit inside this county — more than anywhere else in the system, which is headquartered in Oakland. Nine of them are in Oakland alone, and the line runs south through San Leandro and Hayward to Fremont, and east over the hills to Dublin and Pleasanton.
The MacArthur Maze stacks the 80, 580, 880 and 24 in one interchange west of downtown. Add ferries from Alameda, Oakland, and Jack London Square, and almost every part of this county has more than one way into San Francisco.
Nine across the county
Oakland
James Syhabout's refined Californian tasting menu on Piedmont Avenue — the East Bay's only two-star room.
West Oakland
Twelve seats, thirteen courses, and a farmer-driven menu. Starred within a year of opening.
Berkeley
The restaurant that invented California cuisine. A fixed menu downstairs, à la carte in the café above.
Berkeley
Northern Chinese cooking and the Peking duck that Berkeley plans its birthdays around.
Berkeley
Oaxacan and coastal Mexican with a serious agave program, in the downtown arts district.
San Leandro
Scratch cooking from local farms in a former hat factory — the reason to drive to San Leandro.
Hayward
Michelin-recognized Mexican cooking in an industrial park, which tells you everything about this county.
Pleasanton
Californian small plates built on regenerative meat and responsible seafood, on Main Street.
Oakland & Berkeley
Stuffed deep dish, employee-owned since 1983, with five of its six locations in this county.
Alameda does not have a harvest to organize itself around. What it has instead is a run of street festivals, parades, and neighborhood celebrations that starts with Lunar New Year in February and does not really stop until the lanterns go up at the zoo in November.
Here is what a year actually looks like, from the bay to the Livermore Valley.
Month by month, bay to valley
January
Hills green up
February
Peak green
March
Wildflowers
April
Long light returns
May
Bloom in the valley
June
Fog season begins
July
Inland heat, coastal fog
August
Golden hills
September
Warmest, clearest weeks
October
Harvest & crush
November
First rains
December
Dormant
Drag the slider below to move through the year
A flagship public university does more to a county than educate it. Alameda has the museums, the botanical garden, the repertory theatre, the bookstores, and the restaurant culture that a hundred and fifty years of a university town produces — and most of it is open to anyone.
Cal Day each April opens the labs and collections to the public for free. The rest is open year-round.
The art, history, and natural science of the state under one roof, with a garden built into the architecture.
A planetarium and historic telescopes in the Oakland hills, with free public viewing on clear weekend nights.
Thirty-four acres above the Berkeley campus holding more than ten thousand kinds of plant.
Two thousand acres in the Berkeley hills — steam trains, a 1911 merry-go-round, and the native plant garden.
Eight hundred animals and a gondola up to the California Trail, overlooking the whole bay.
The carrier that recovered the Apollo 11 and 12 crews, moored at Alameda Point.
Private
Districting matters here more than almost anywhere. Oakland and Berkeley both assign by neighborhood, Piedmont and Albany run their own small districts, and boundaries frequently split a single street. Tell us which district you need and we'll identify properties inside its lines before you tour anything.
1,651,950 people live in Alameda, where the median age is 38.7 and the average individual income is $63,442. Data provided by the U.S. Census Bureau.
Total Population
Median Age
Population Density Population Density This is the number of people per square mile in a neighborhood.
Average individual Income
Alameda has 593,117 households, with an average household size of 2.73. Data provided by the U.S. Census Bureau. Here’s what the people living in Alameda do for work — and how long it takes them to get there. Data provided by the U.S. Census Bureau. 1,651,950 people call Alameda home. The population density is 2,240 and the largest age group is Data provided by the U.S. Census Bureau.
Total Population
Population Density Population Density This is the number of people per square mile in a neighborhood.
Median Age
Men vs Women
Population by Age Group
0-9 Years
10-17 Years
18-24 Years
25-64 Years
65-74 Years
75+ Years
Education Level
Total Households
Average Household Size
Average individual Income
Households with Children
With Children:
Without Children:
Marital Status
Blue vs White Collar Workers
Blue Collar:
White Collar: